6 MPLAB® Data Visualizer
The MPLAB® Data Visualizer is a program used to process and visualize key data points, from a running embedded target, in real-time. The utility may be accessed as an MPLAB® X IDE plugin or as a standalone program. The latest version of MPLAB® Data Visualizer is available for download on the MPLAB® Data Visualizer product page.
- Capture data, streamed from a running embedded target, via virtual serial port (USB) or the Data Gateway Interface (DGI)
- Decode data fields at run-time using the Data Stream Protocol format
- Visualize the raw or decoded data in a Graph as a time series or display the data in a terminal
- Concurrently stream data and debug target code
Each configuration is set up to send data over USART as a Data Visualizer data stream. The values of interest are the input and output signals. Both signals will be displayed in the main Graph area of the MPLAB® Data Visualizer. The interface and underlying settings are configured through a saved workspace available in a folder, named data-visualizer.
To get a workspace up and running, follow the steps below:
- Open the Atmel Studio 7 solution Getting_Started_with_OPAMP by navigating to the GitHub repository and selecting Getting_Started_with_OPAMP.atsln. The solution contains separate projects for each configuration detailed in the present document.
- Set the desired project as
StartUp Project, by right clicking on the project of interest and
from the pop-up menu select Set as StartUp Project option.
Figure 6-2. Atmel Studio 7 - Set Start-up Project - Build the solution by selecting Build → Build Solution or by pressing F7.
- Program the AVR DB device by selecting Debug → Start Without Debugging from the top menu bar.
- Open MPLAB® Data Visualizer.
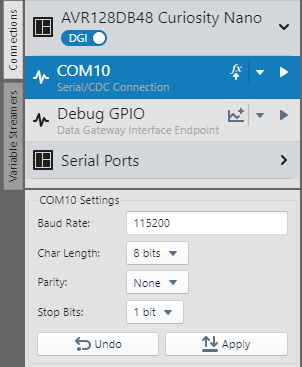
- Load the workspace. Press the Load Workspace button and add the workspace-file corresponding to the configuration, available in the GitHub repository. Two axes should appear in the graph.
- Set the correct Serial Port
settings. Choose the COM-port on the left hand side panel seen in Figure 6-3. Make sure the Baud Rate is
115200 and press the play button (Start Streaming).
Figure 6-3. MPLAB® Data Visualizer - Serial Port Settings 
- Ensure the COM port is selected
as a source for the Variable Streamer Decoder.
Figure 6-4. MPLAB® Data Visualizer - Variable Streamers - If successful, two graphs representing the input and output signals will be drawn on the screen. The Y-axis represents the magnitude of the signal in mV, while the X-axis represents elapsed time.
