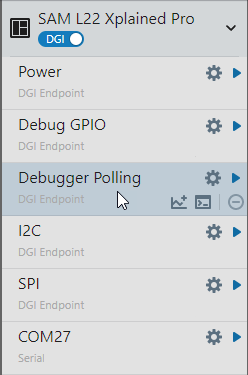
For selected debuggers and kits, the DGI section of the connections panel will contain a
“Debugger Polling” interface section. Through this interface, the Data Visualizer can
display sampled PC values in visualizations, e.g., as points in the time plot. Figure 4-42. Debugger Polling
Interface
Note: PC sampling is only available in the
plugin version of MPLAB Data Visualizer, as it depends on resources in the debugger
implementation in order to sample the PC (Program Counter).
Note: Debuggers, like MPLAB ICE 4 or the
Power Debugger, always report the Debugger Polling interface as available, irrespective
of which target device is being debugged. However, not all device architectures support
PC sampling. In general, the PC sampling feature will work for all SAM devices as well
as newer AVR devices.
The Data Visualizer can show PC values and, e.g., current measurements in the same graph.
This allows you to see a correlation between consumed power and the executed code.
The sampled PC values will only show part of the code execution, as in most cases it is
impossible to read out the PC values as fast as the target is executing instructions.
The sampled values are still useful to indicate which code segment is being executed at
any point in time. Each time the PC is read out from the target, we get the exact
address of the code location currently being executed.