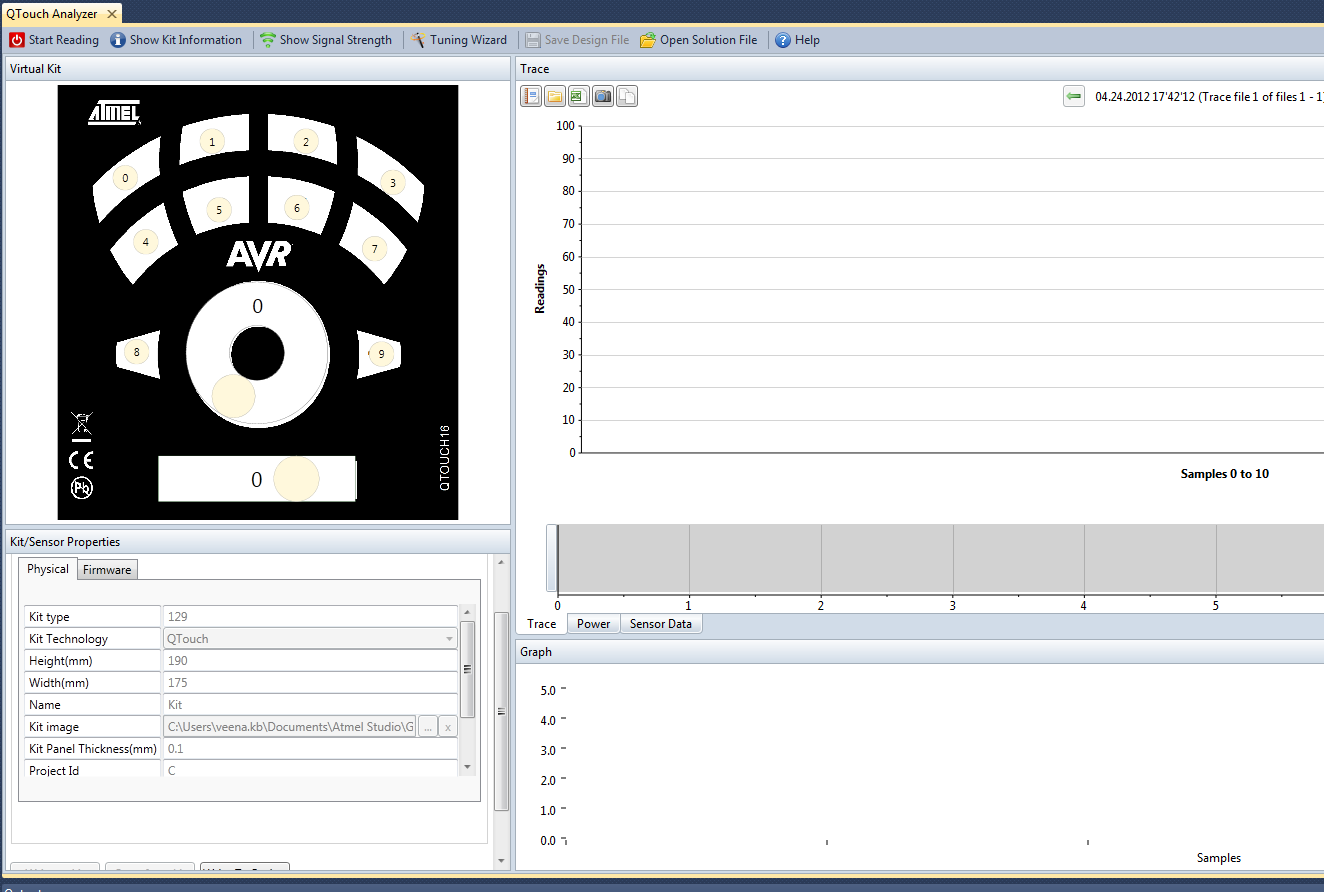
9.6.3 Overview of the QTouch® Analyzer
The QTouch Analyzer reads and interprets touch data sent from the QTouch kit into different views. The Analyzer is separated into Kit View, Kit/Sensor Properties, Sensor Data, Trace View, Power View, and Graph view. When the touch kit is connected and Microchip Studio is opened, the QTouch Analyzer window opens, and the connection information is updated.
The Virtual Kit view shows touch events such as button press, wheel, and slider use. The image is updated based on the touch data read from the connected Touch Kit.
The Kit/Sensor Properties view allows you to view and modify the kit/sensor configuration options.
The Sensor Data View provides touch data information of the currently connected kit.
The Graph View displays one or more selected touch data on a graph. The Graph shall display the most recent touch data. The dataset to show can be selected from the dataset list on the right side of the view. The datasets are displayed in tabbed pages representing the Signals, Deltas, References, and Wheel/Slider positions. Each dataset selection list follows an ordinary selection convention; click on an item in the list to select that item. Click on the first item, then hold down the SHIFT key and select the last item in the range to select a continuous range of items. Multiple items can also be selected one at a time by holding down the CTRL key before selecting the next item in the list. In the last case, the items need not be in a continuous range. Using CTRL select method also allows deselection of individual items from a selection of multiple items.
The trace contains one or more data series with touch data in a chart. The trace keeps all historical data of a single reading session (pressing start and stop reading), and the data can be saved in a separate file and opened again later.

