
6 Running the Demo
(Ask a Question)This section describes how to optimize DFE coefficients and check the result on board.
Prerequisites for the procedure:
- The PolarFire Evaluation board is connected.
- The PolarFire FPGA is programmed with the DFE design.
To run the demo, perform the following steps:
- After the device is programmed,
change SW11 DIP1 from 0 to 1. This brings the CoreABC
interface out of reset and starts DFE calibration.Important: Trigger for DFE calibration is also generated by monitoring the condition (RX_READY and RX_IDLE).
- Observe if LED4 is OFF, and LED10 and LED5 are in ON state. This signifies that run time DFE calibration is complete and there is no bit error. Here LED4 represent bit error status, LED10 represent data lock flag signal, and LED5 represents DFE calibration status.
Eye Monitor enables visualizing the eye diagram present within the receiver. This feature plots the receive eye after the CTLE and DFE functions. For plotting the Eye Diagram, follow the following procedure.
On the Design Flow window, perform the following steps:
- To generate data for SmartDebug Design, click Generate SmartDebug FPGA Array Data. Once the data is generated, a green tick mark is seen on the left side of the option indicating that the data generation is successful.
- To open SmartDebug
Design, double-click Debug Design.
Figure 6-1. Launching SmartDebug Design 
- Open the
SmartDebug window, and then click Debug
TRANSCEIVER as shown in following figure.
Figure 6-2. SmartDebug Window Debug Options 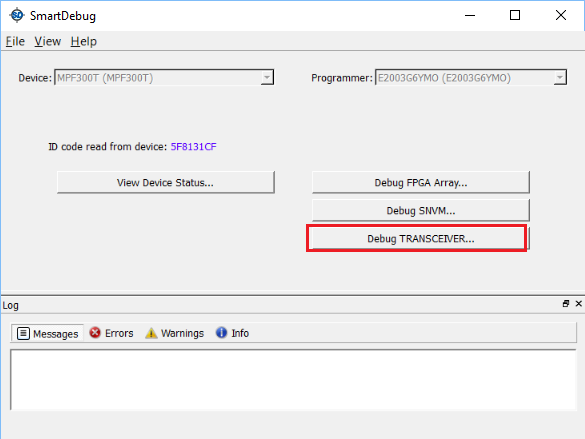
- On EYE Monitor tab, select LANE0.
- To plot the eye, click Plot Eye.
The following figure shows the Eye Plot.
