7.6 Visualize Streaming Data
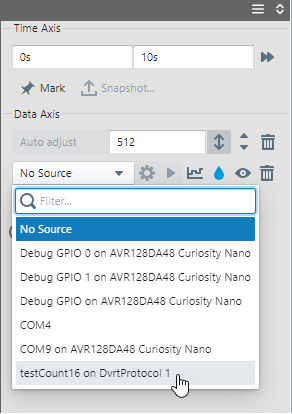
Variable data shown on the DVRT Streaming Table may be visualized as other streaming data is visualized: on time plots, in the terminal, on the Dashbord, or on an XY plot. For example, to show data on a Time Plot, select the variable as a source (see the figure below).
For more information, see Visualization.