4.4.1.2 MPLAB Data Visualizer Setup
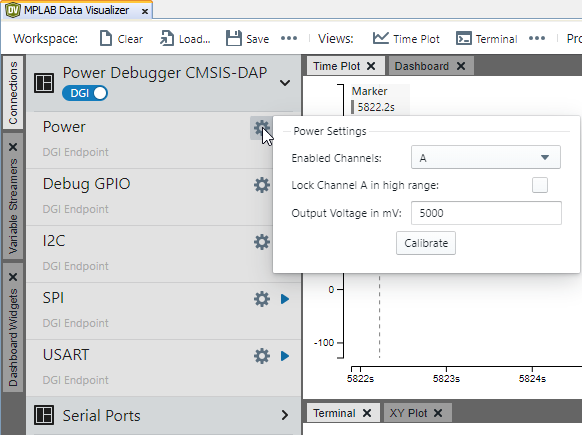
Launch the MPLAB Data Visualizer. When the tool is detected, a power selection will be available under the tool DGI connection (see figure below.)
Click on the Power Source options icon  and then
enter Power Settings. Click on the icon again to save settings and close.
In the image below, the selections are Channel A for current sense and VOUT as 5000 mV (5V).

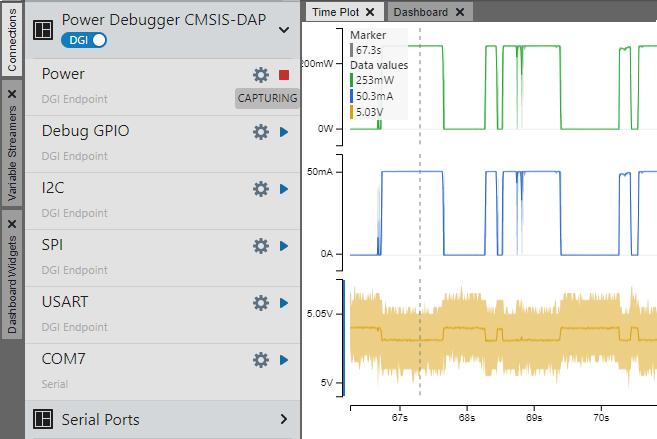
To see the power data plots, hover over the Power interface until the icon for displaying
all sources on the time plot is visible  and click
on it.

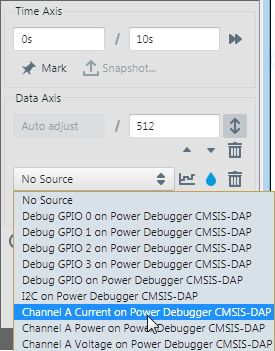
To select a single plot, select it from the plot options.

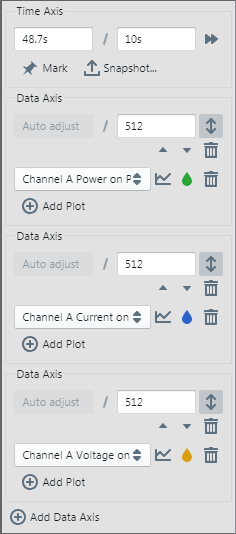
If all sources are plotted, by default the power plot will be first, the current plot second and the voltage plot third. For more on the noise in the third plot, see Noise in Power Plots.

To change plot formatting use the controls on the right pane.

