10 Data Visualizer Setup
10.1 Data Visualizer Debug GPIO Setup
The image below shows the (Timer Toggle LED Example), which uses Debug GPIO from the MPLAB Data Visualizer. The following configuration steps are needed to set this up:
- Click the
 icon
to open the MPLAB® Data Visualizer.
icon
to open the MPLAB® Data Visualizer. - Under Debug GPIO, click the
 icon,
to add to the time plot.
icon,
to add to the time plot. - Click the
 Horizontal Zoom button, or use the mouse scroll wheel to zoom into the Time Plot.
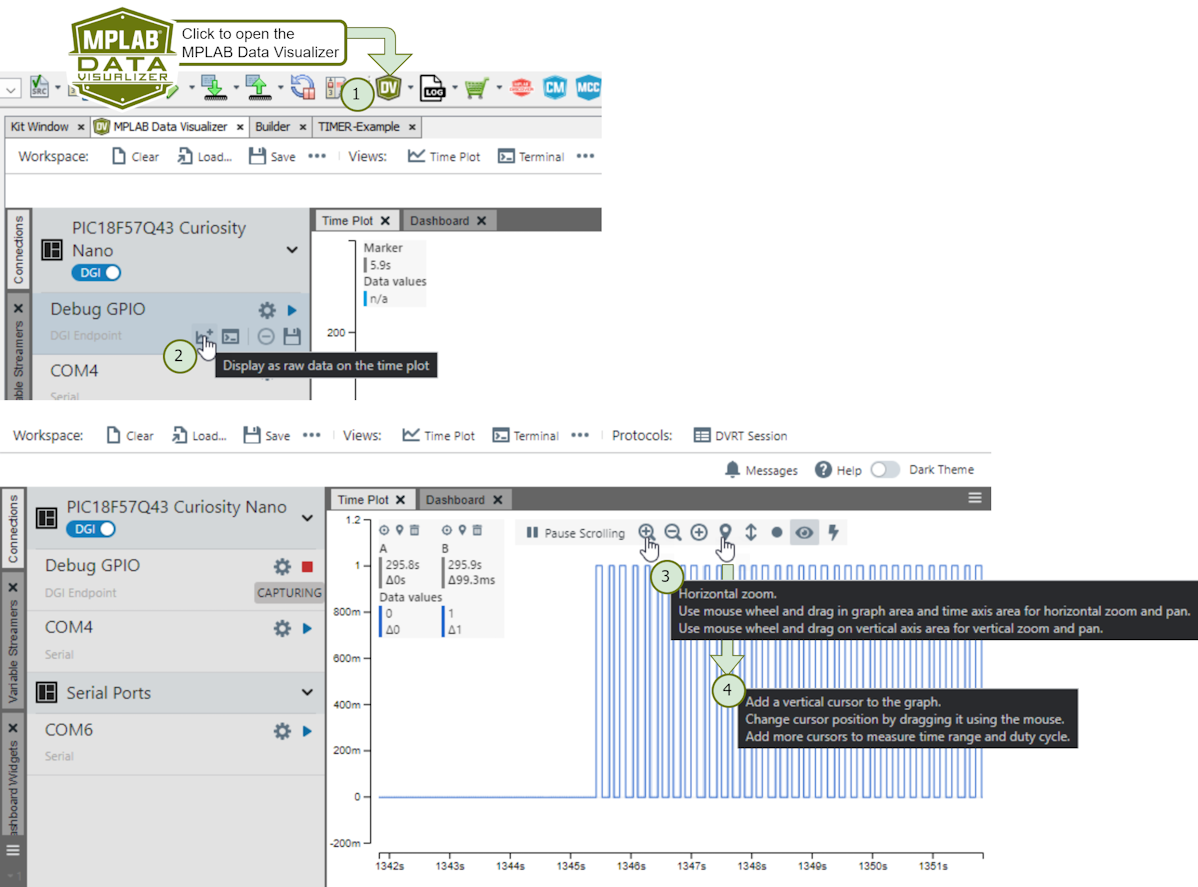
- Click the
 Vertical Cursor button to add cursors. You can then measure the time between
cursors.
Vertical Cursor button to add cursors. You can then measure the time between
cursors. 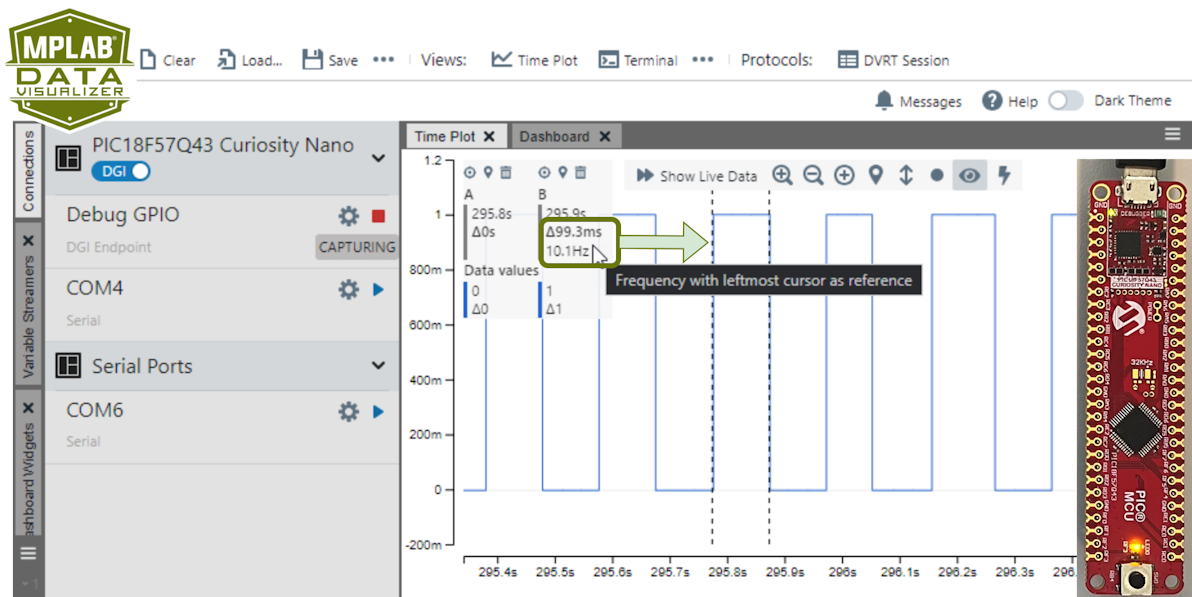 Tip:
Tip:- Go to AVR TCA PLIB Driver, PIC Timer0 PLIB Driver for a video on how to use the MCC Melody 100 ms Timer.
- If you are new to MPLAB® Data Visualizer, see Debug GPIO Hello World (Microchip University).
10.2 Data Visualizer Terminal Setup
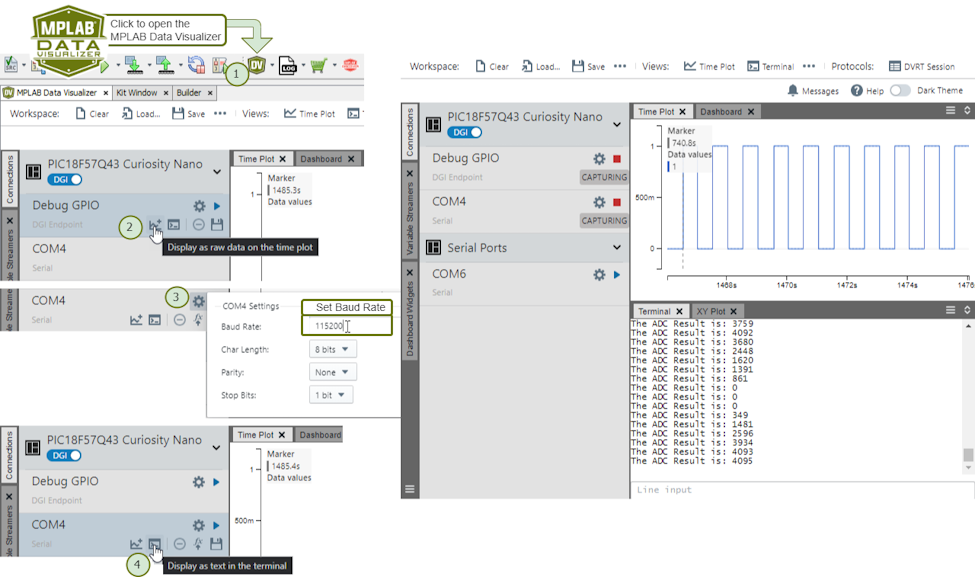
The image below shows an example (ADCC Basic Printf), which uses both Debug GPIO and the Terminal, from the MPLAB Data Visualizer. The following configuration steps are needed:
- Click the icon
to open the MPLAB Data Visualizer.
- Under Debug GPIO, click the icon,
to add to the time plot.
- Under the COMx port, associated with
your board, click the
 icon to set the baud rate to 115200.
 - Then click the
 icon
to display text from the COMx port on the terminal.
icon
to display text from the COMx port on the terminal.
When using the MPLAB Data Visualizer Time Plot to run the ADC with Computation Basic Printf example, the following will appear:
10.3 Data Visualizer Setup for MCC Melody Data Streamer
 to
generate code.
to
generate code. 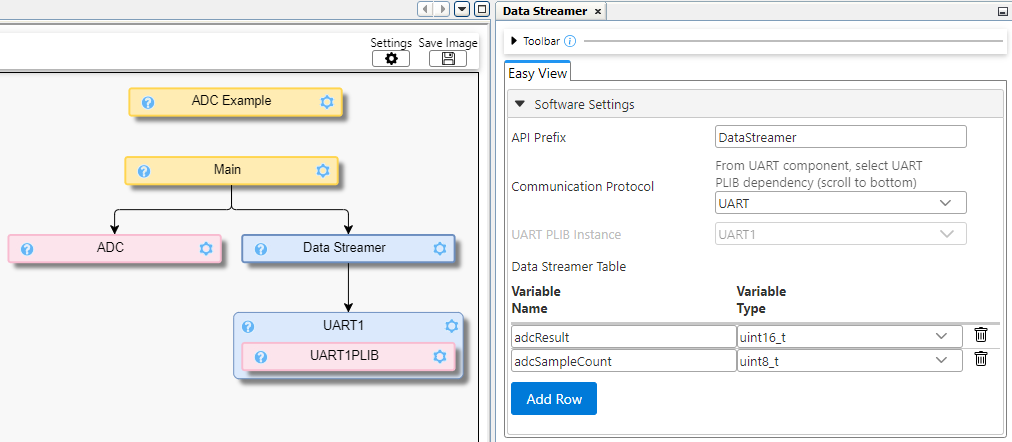
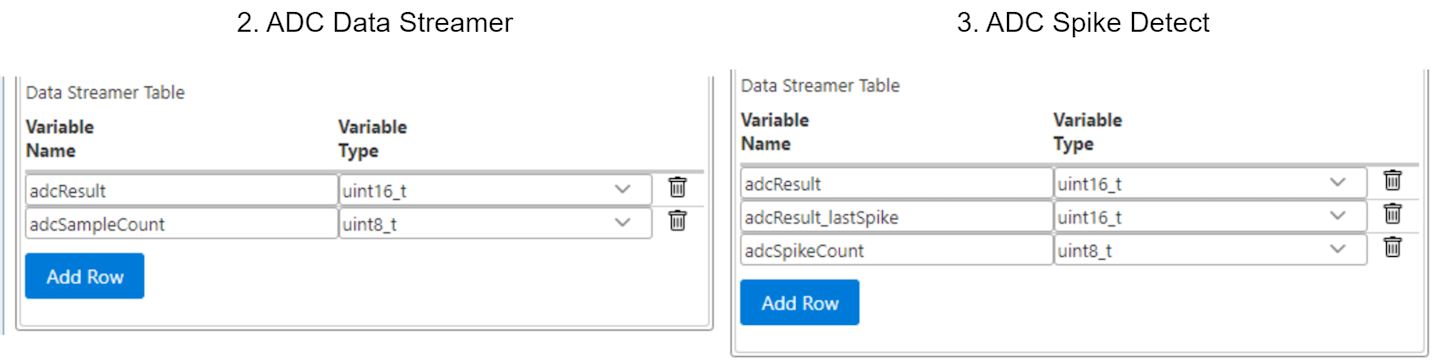
As part of the MCC Melody configuration, application variables to be plotted must be added to the Data Streamer Table, giving each a Variable Name and corresponding Variable Type. Once done, this will look similar to examples 2 and 3 from the ADC Example Component.
- Within MPLAB X click the icon
to open the MPLAB Data Visualizer.
- Under the Variable Streamers
tab (on the left-hand side), click the
 button
to import a
button
to import a .dsfile. - From your project root, navigate into
mcc_generated_files/data_streamer/directory. - Click the
data_streamer.dsfile to select it. - Then click the
 button
to load the ds file.
button
to load the ds file.
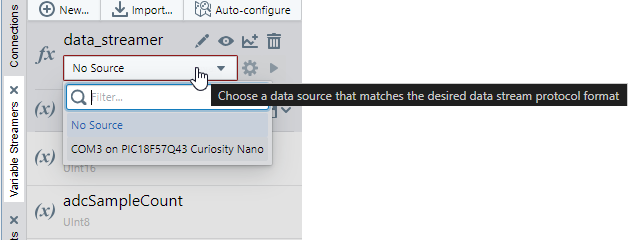
Data Visualizer Configuration
data_streamer.ds, meaning the Data Streamer variable configuration
file, as follows: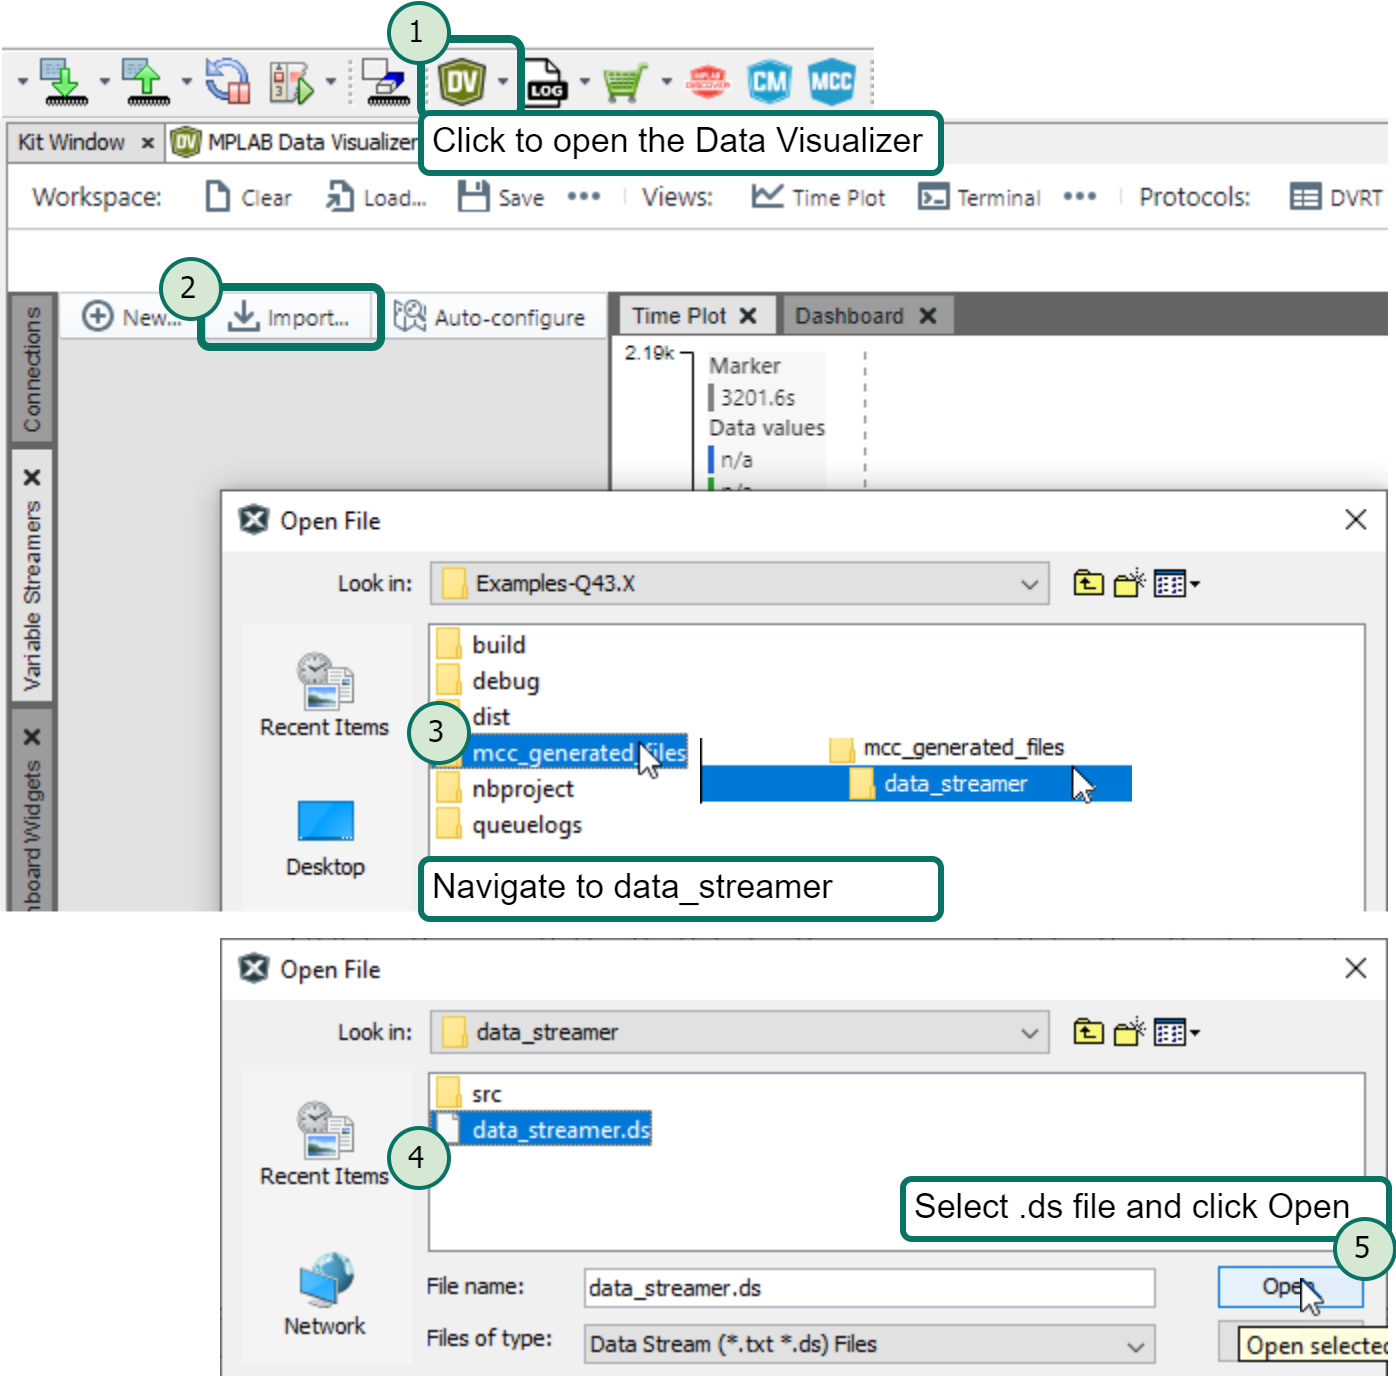
Choose a data source that matches the desired data stream protocol format
Plot all variables
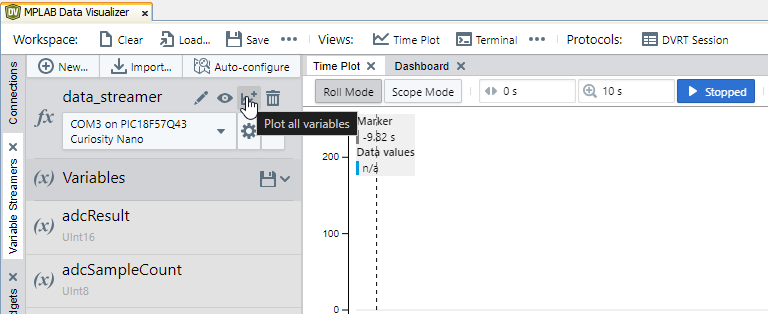
 . Plot
all variables sets this to
. Plot
all variables sets this to  .
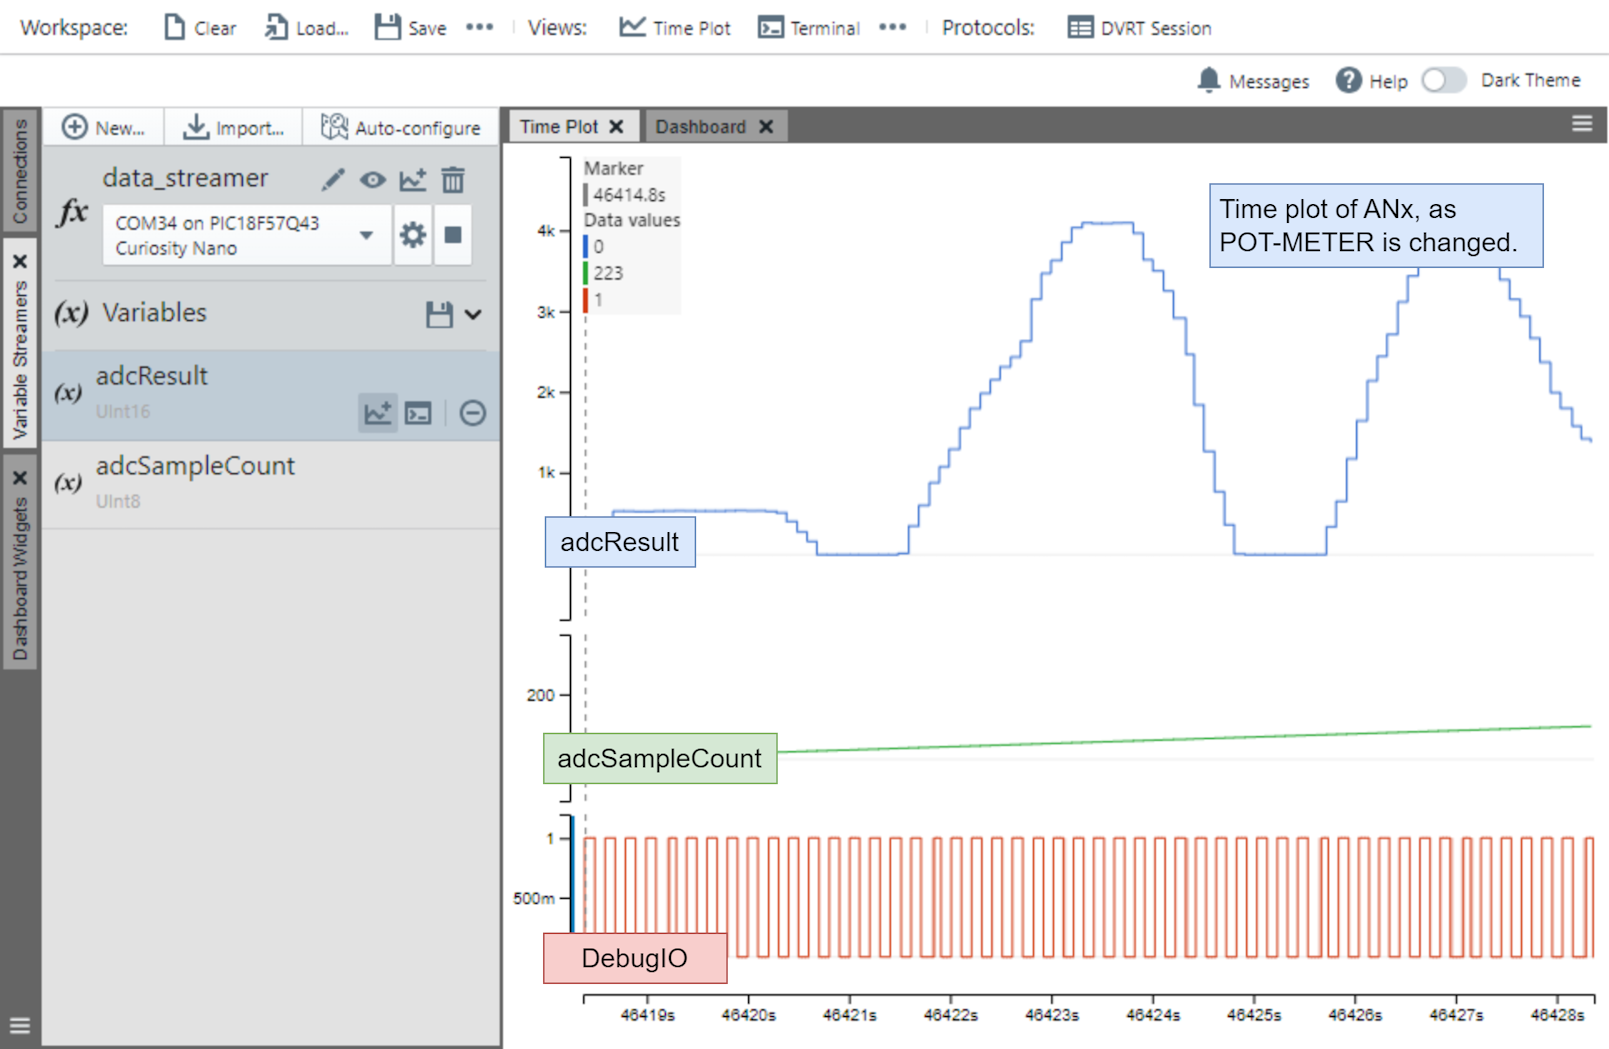
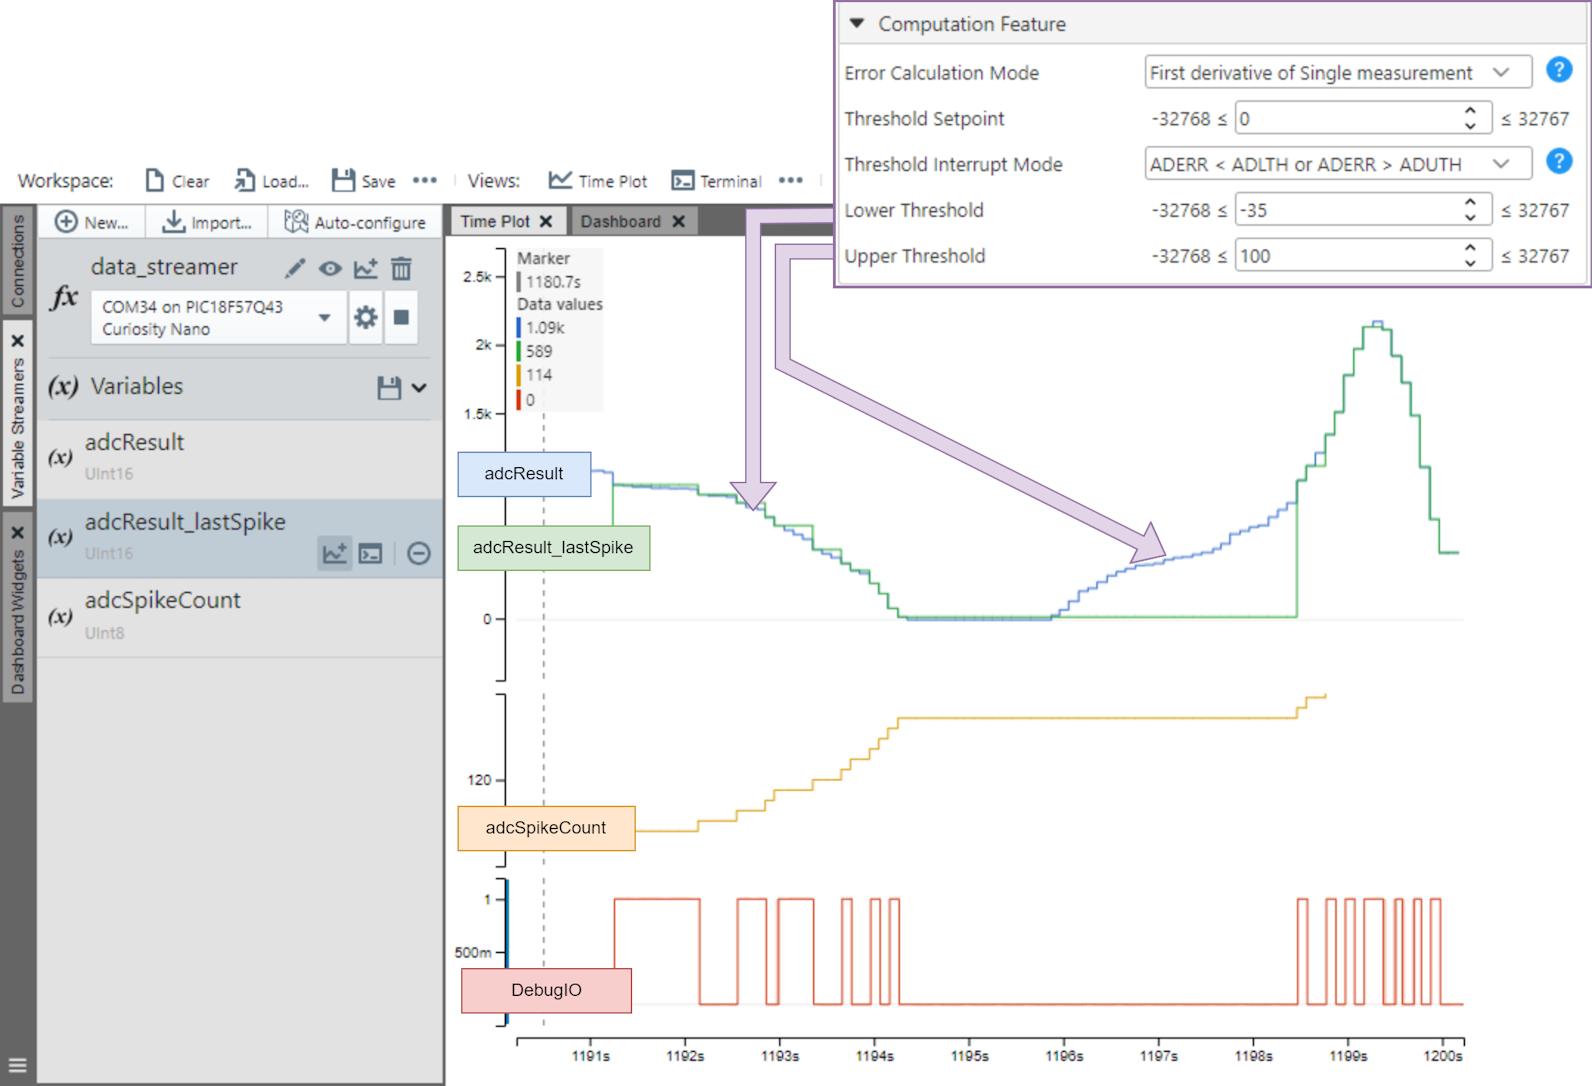
.The results when plotting the respective examples are shown below:
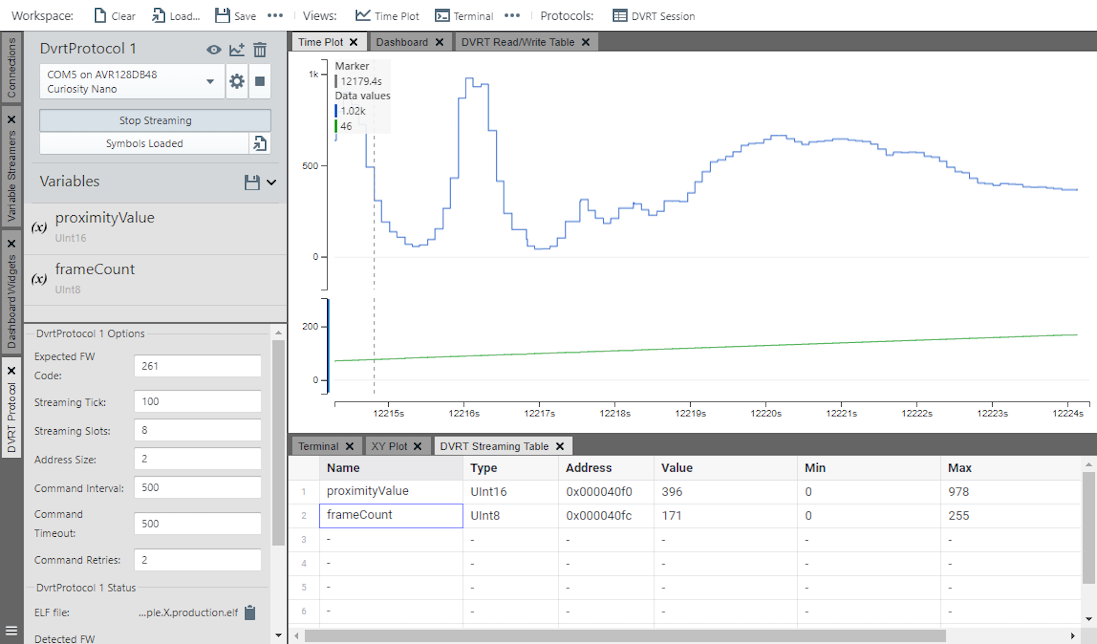
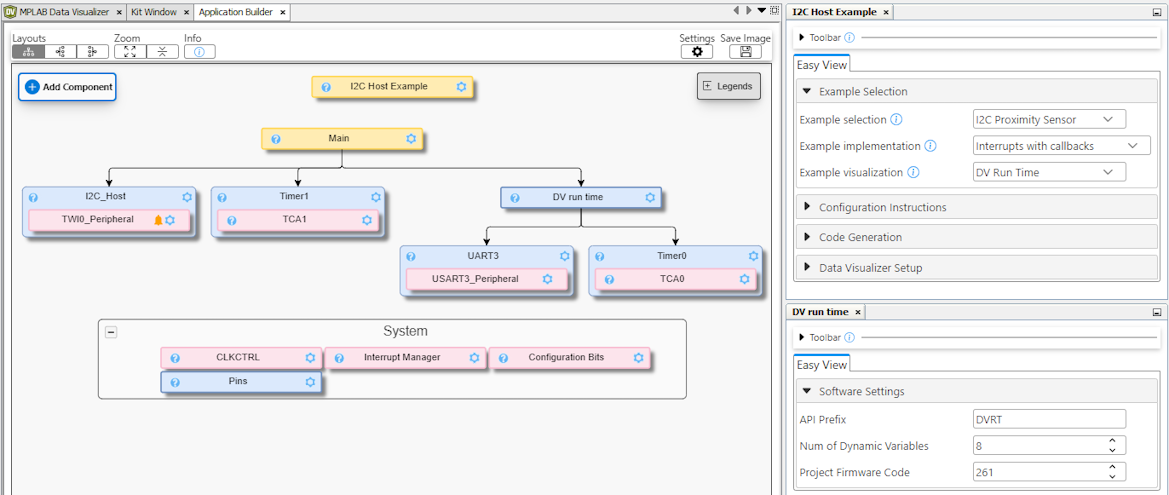
10.4 Data Visualizer Setup for DV Run Time
 button
is pressed to generate the code.
button
is pressed to generate the code. .elf file. To increase the ikelihood that a
variable's debug symbol can be found, set the variable to volatile and/or static. .elf
file contains their name, address and type (length in bytes), i.e., at compile time, it
is known where volatile variables will be located in the Microcontroller's RAM.- Within MPLAB X click the icon
to open the MPLAB Data Visualizer.
- Click on the Under the
 button
to start a new, or show current DVRT Session.
button
to start a new, or show current DVRT Session.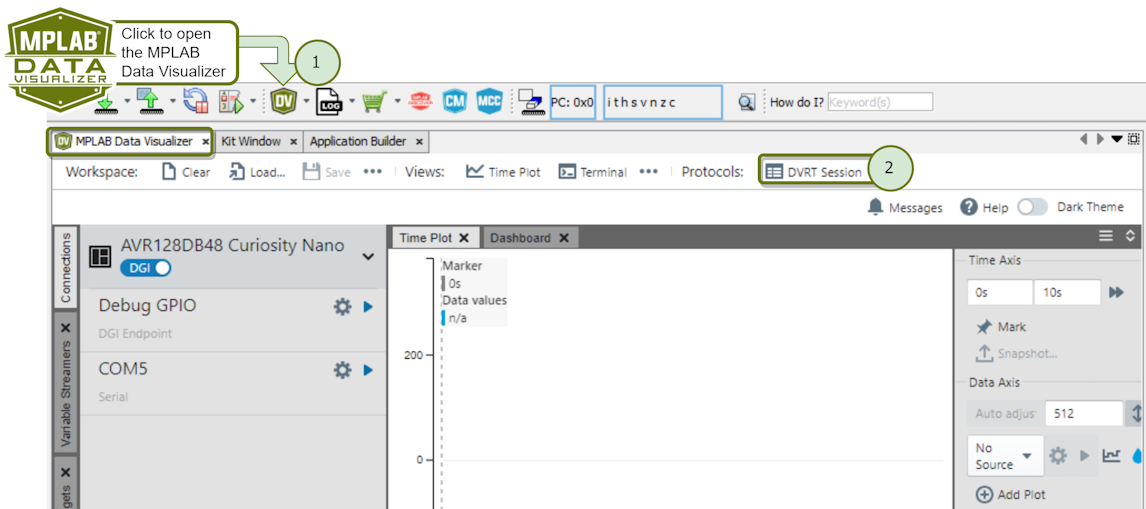 Tip: A new DVRT Session will open as follows:
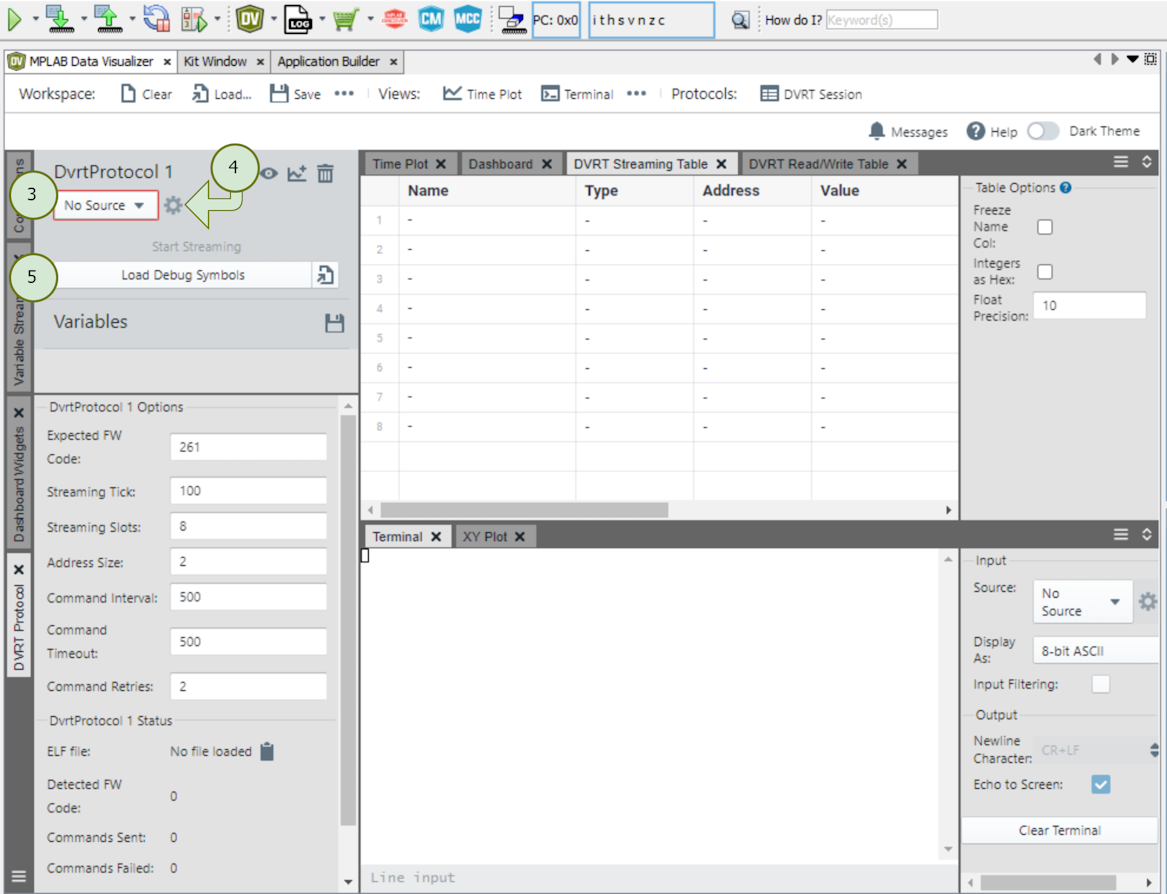
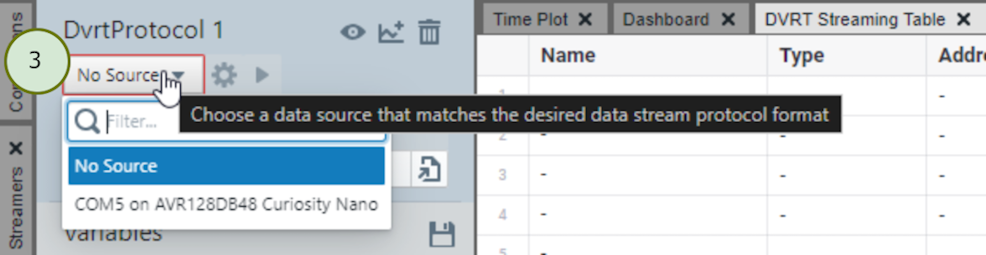
- Next one needs to select a data
source matching the DVRT protocol format. This will be the COM port (UART) that was
configured as a dependency to the MCC Melody DV Run Time Library.
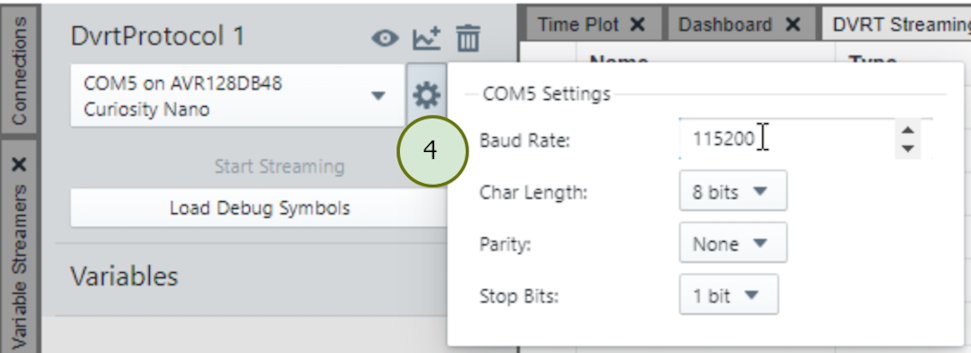
- Configure the Data Visualizer COM
Settings (PC side) to match what was configured in the MCC Melody DV Run Time
Library (MCU side).
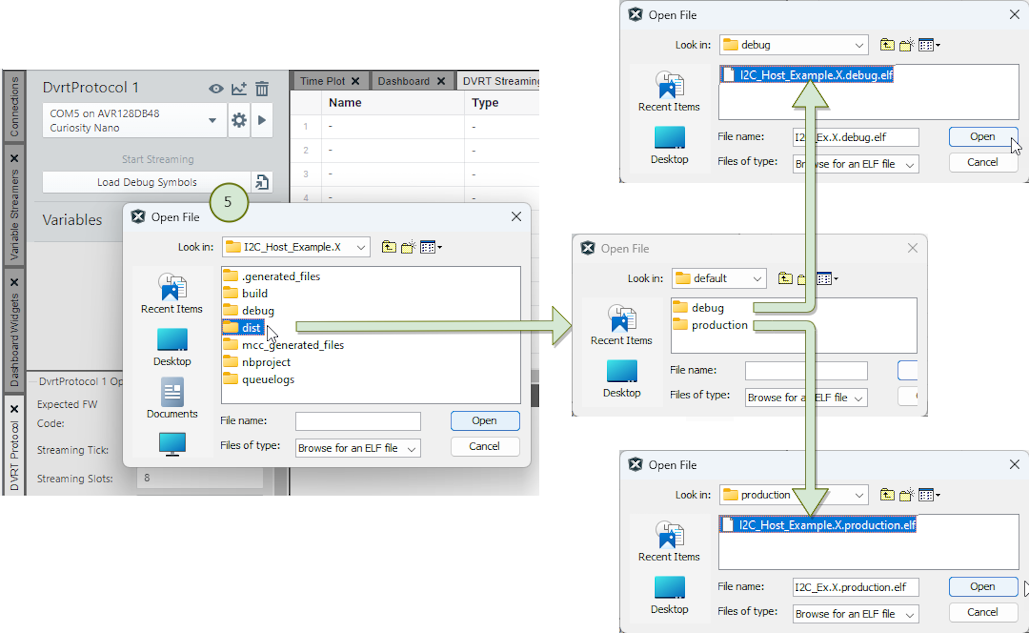
- Next load the
.elfdebug symbols file.Attention: You must choose the debug or production version of the.elf, matching your compilation settings.- Debug, if you are in a debug session
- Production, if you
have simply programmed your MCU

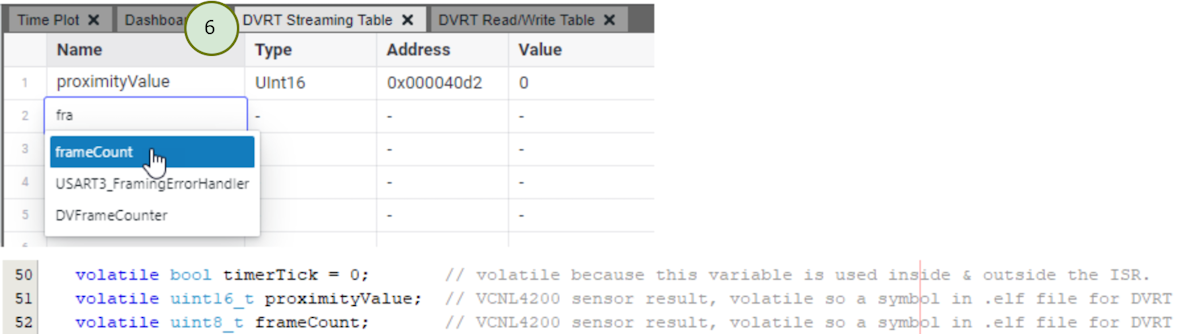
- Add variables to DVRT Streaming
Table.Tip: The volatile and static variables will show up in the symbols file.
- Reposition DVRT Streaming Table.
Tip: One can drag the DVRT Streaming Table to the bottom pannel of the Data Visualizer, to view this table at the same time as the Time Plot of variables.
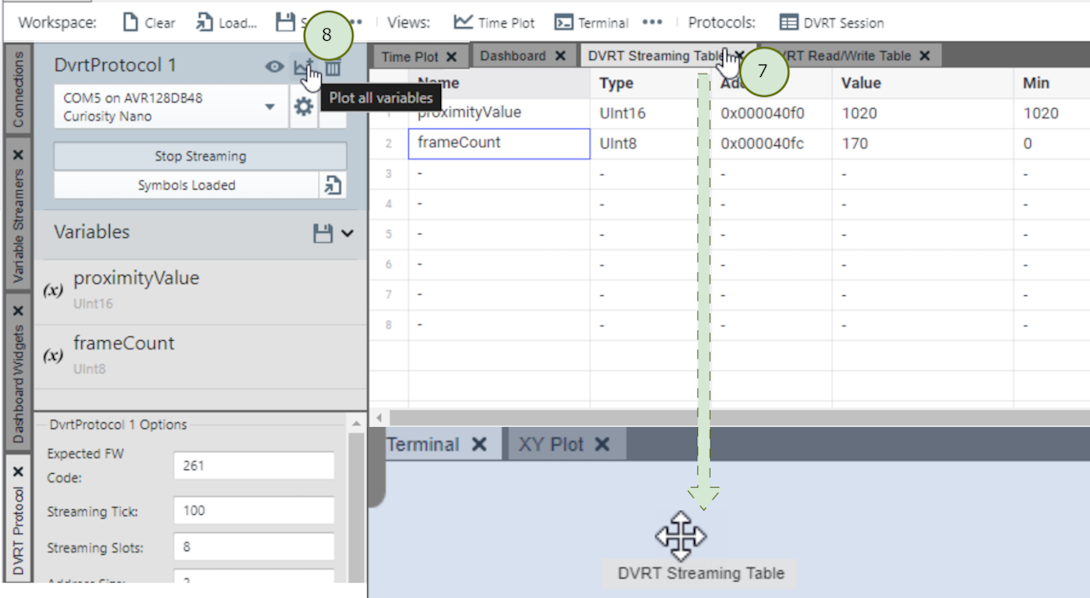
- Once you click the
 Plot
all variables button, the Dvrt Procol starts streaming and the Time Plot starts
rolling.
Plot
all variables button, the Dvrt Procol starts streaming and the Time Plot starts
rolling.