
10 Tools and IDEs
The Nano Debugger is supported by multiple front-end tools published by Microchip, our partners and the open-source community.
10.1 Partner Ecosystems
The Nano Debugger is supported by various partner ecosystems and IDEs. The CMSIS-DAP standard debug implementation it is based on effectively provides support for any ARM Cortex device. The AVR protocol specification is public, and various IDEs that support AVR devices also support the Nano Debugger (This is the same protocol as used in JTAGICE3, Atmel-ICE, PowerDebugger, and EDBG.)
- IAR Embedded Workbench
- Keil Microvision
- CodeVisionAVR
- OpenOCD
- pyOCD
- AVRDUDE
- PlatformIO
- Bloom
- probe-rs
10.2 MPLAB® Tools for VS Code
The Nano Debugger is supported in the VS Code development environment. As a standard CMSIS-DAP debugger, it supports generic debug adapters for ARM Cortex devices and frameworks built using these mechanisms. In addition, it is supported by MPLAB Tools for VS Code.
The MPLAB Tools for VS Code can be downloaded from the MPLAB Extensions official website or from the VS Code Marketplace. Each resource provides a complete list of MPLAB extensions that can be installed individually or together as part of the MPLAB Extensions Pack. The installation is performed through the VS Code Extensions. Tutorials are available on the official website with links to the Extensions Developer Help and the MPLAB Extensions for VS Code Video playlist.

10.3 Using MPLAB Data Visualizer
The Nano Debugger, via its USB/serial bridge, facilitates a connection between a UART on the target MCU and your computer's COM port. For example, you can use this to connect to MPLAB Data Visualizer or other terminal programs.
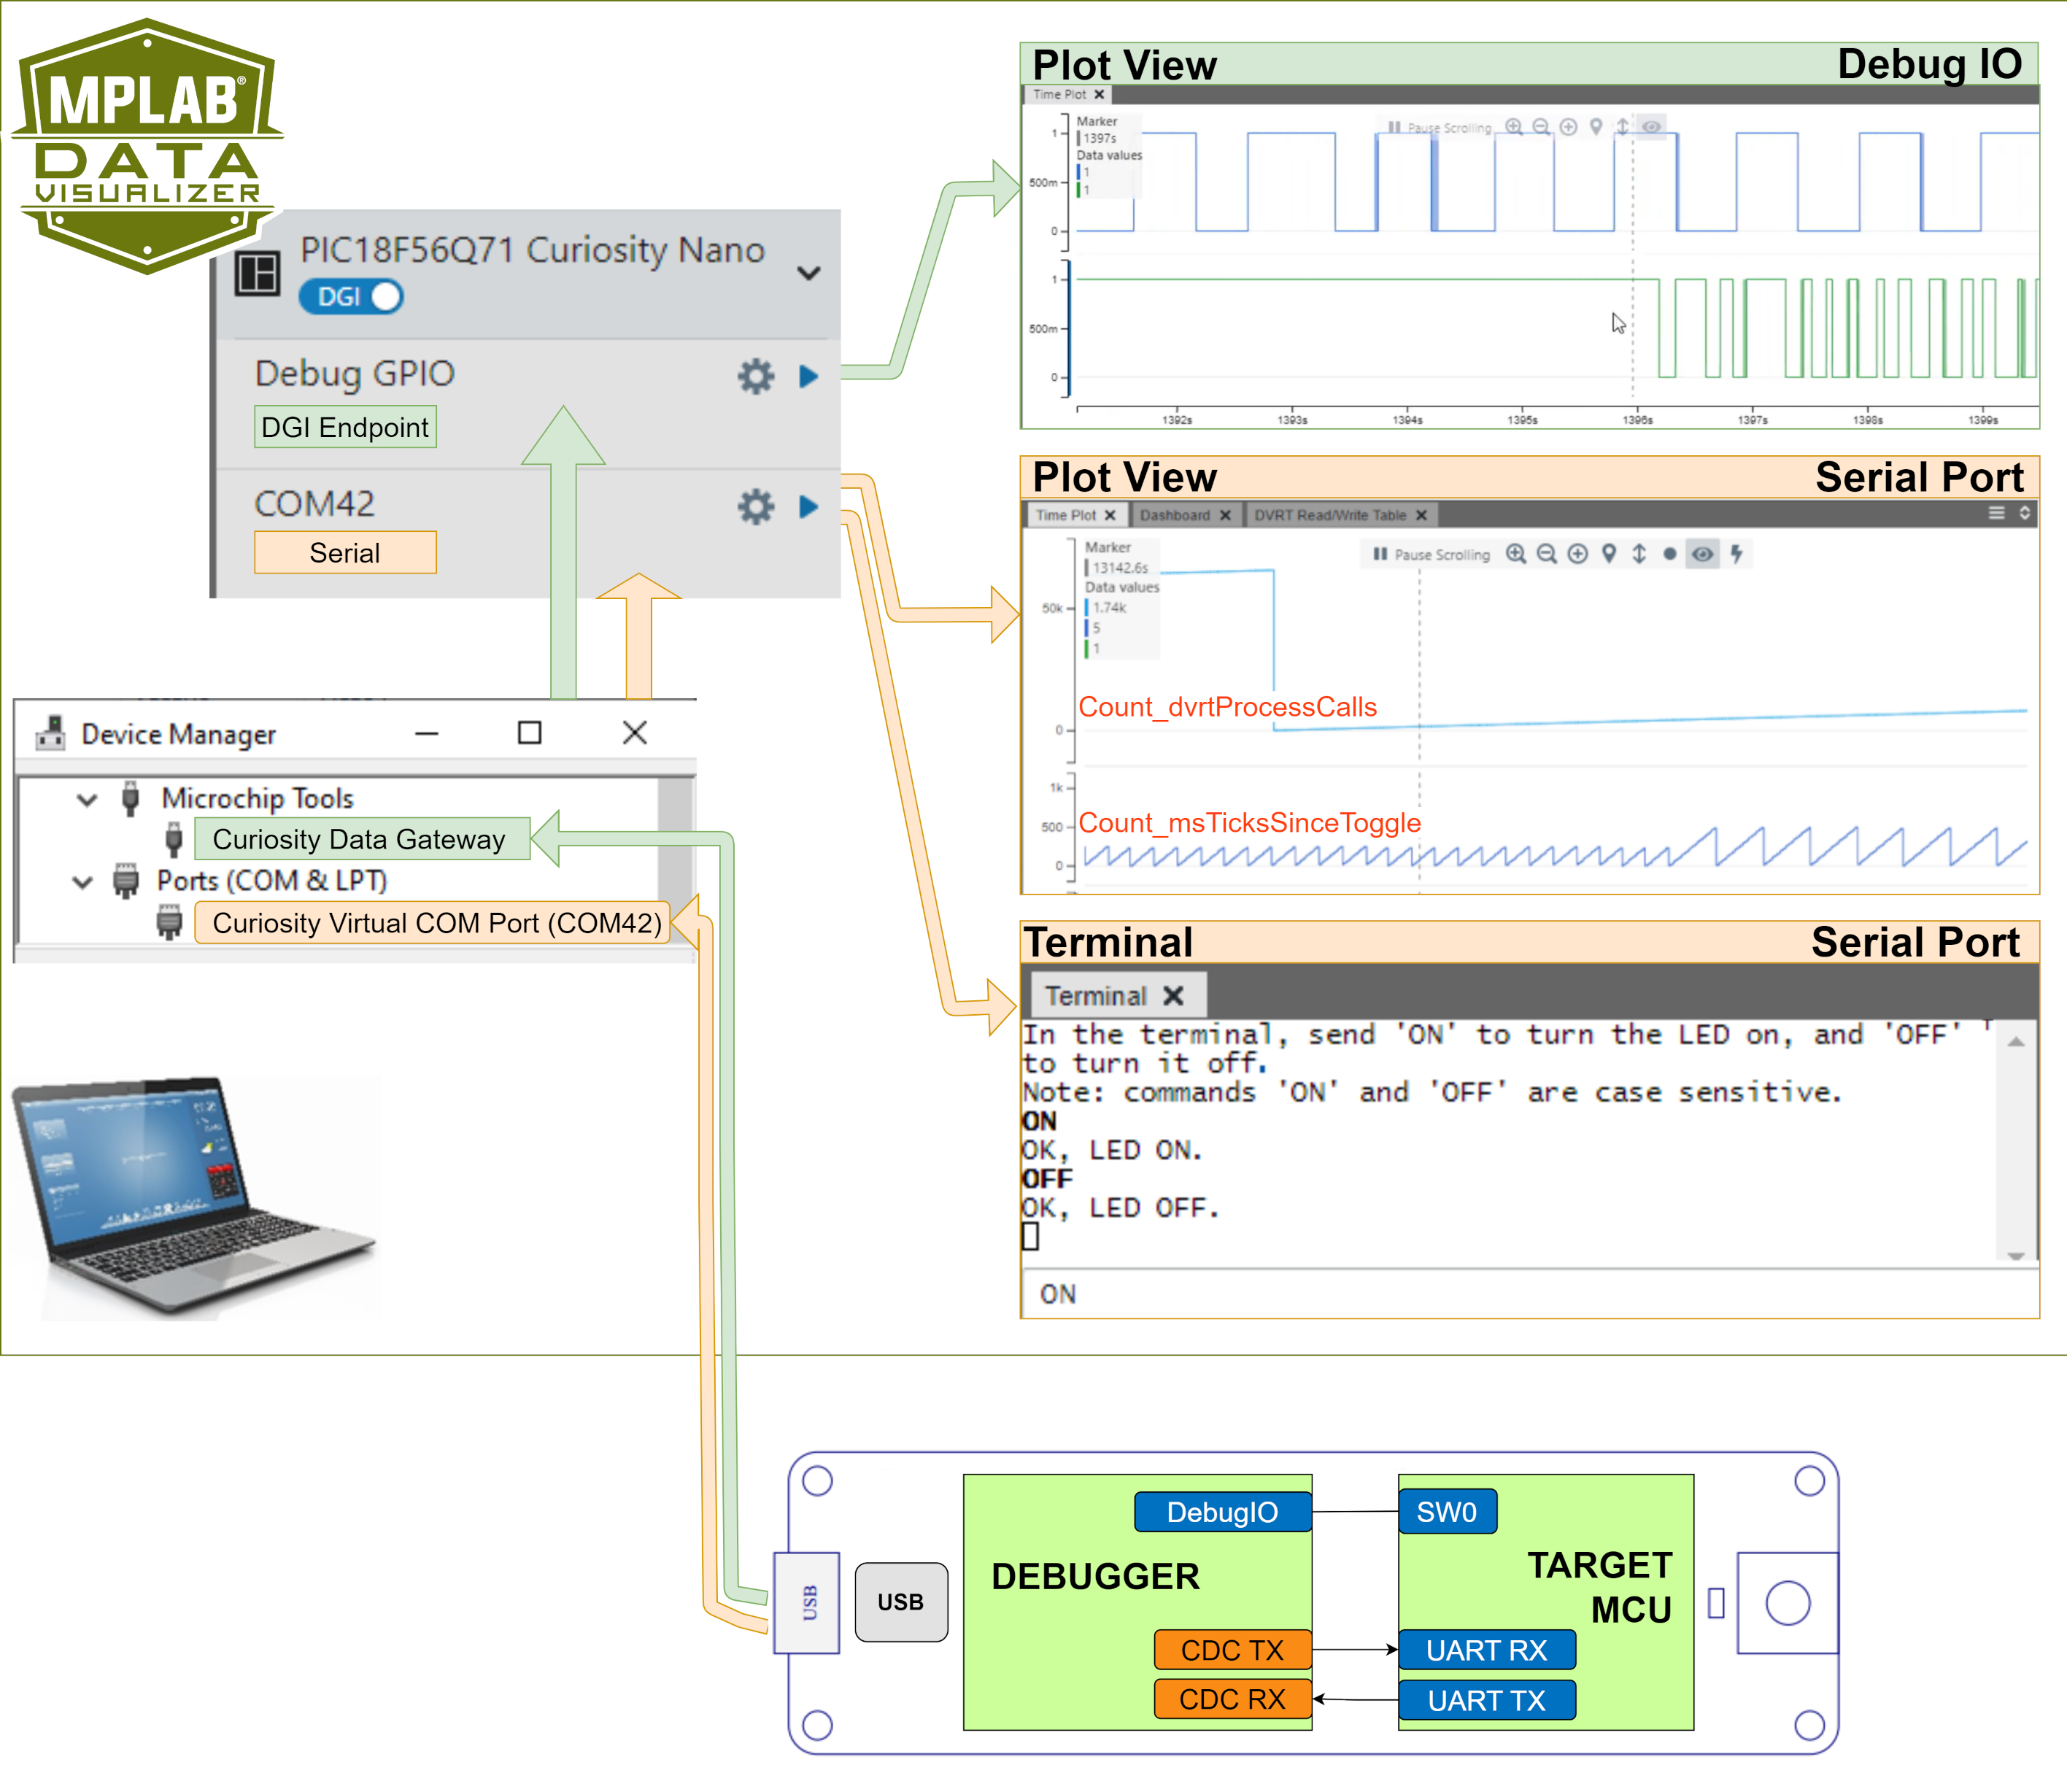
- Plot View - DebugIO: DebugIO Hello World (Microchip University).
- Plot View - Serial Port: MCC Melody Use Case Data Visualizer Run Time Use Case 1.
- Terminal - Serial Port: MCC Melody UART Driver: LED Control Commands.
10.4 Kit Window View
Microchip IDEs have a mechanism for detecting Microchip tools connected via USB and presenting useful information in a Kit Window. This includes, for example, an image of the kit in question, ordering information for the kit and/or the device mounted on it, schematics, and links to example projects.
This view is rendered in each IDE with a different look and feel, but the data is deployed on a web server. Updates to the database are not synchronised with any IDE release cycle.
Some of the data presented in the Kit Window is read from the connected kit and not retrieved from the database. This data is stored in the Board Configuration of the Nano Debugger, and can thus be modified by kit developers (partners) as well as by end-users.
For an example of the Kit Window view, see MPLAB X.
10.5 MPLAB X
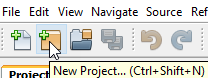
When a Nano Debugger is connected to a host PC via USB, if MPLAB X IDE is open, a Kit Window is opened with several key links presented.
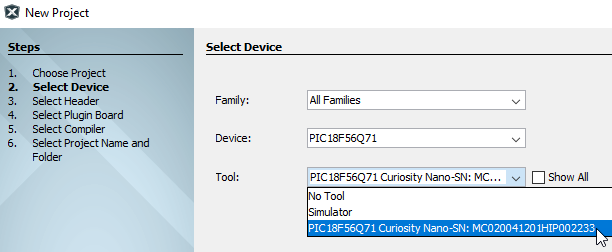
When creating a new project using a development board that includes a Nano Debugger (for example, a Curiosity Nano kit), the part number will be read from the connected board. Nano Debuggers in a standalone configuration will not have this information so the part number must be entered manually.
As shown in the image below, additional information about your Curiosity Nano can be seen in the "Debug Tool" window once you click "Refresh Debug Tool Status".
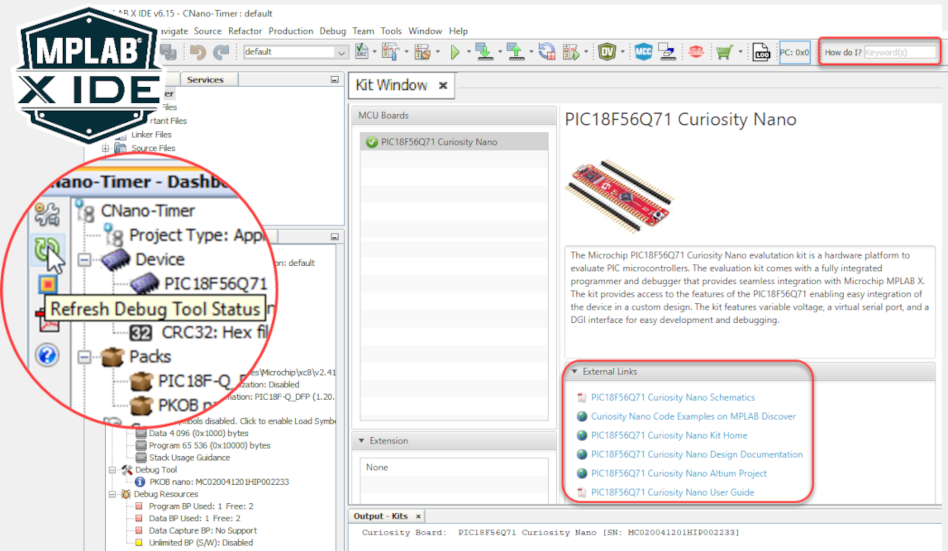
- If closed, you can reopen the Kit Window in MPLAB® X IDE through the menu bar: Window > Kit Window
- The 'How do I?' search bar often provides excellent results if you're new to MPLAB X IDE
- 'Debug main project" will start a debug session
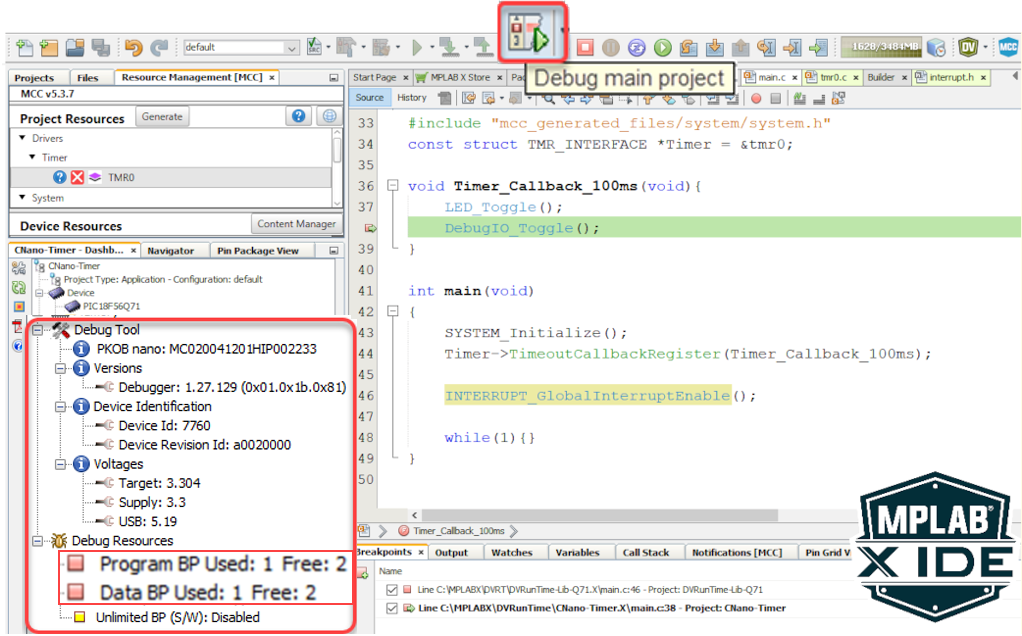
- After clicking on 'Refresh Debug Tool Status,' you can see information such as MCU Target Voltage
- What are Program- and Data-Break Points? MPLAB X IDE Advanced Debugging - Breakpoints Demo
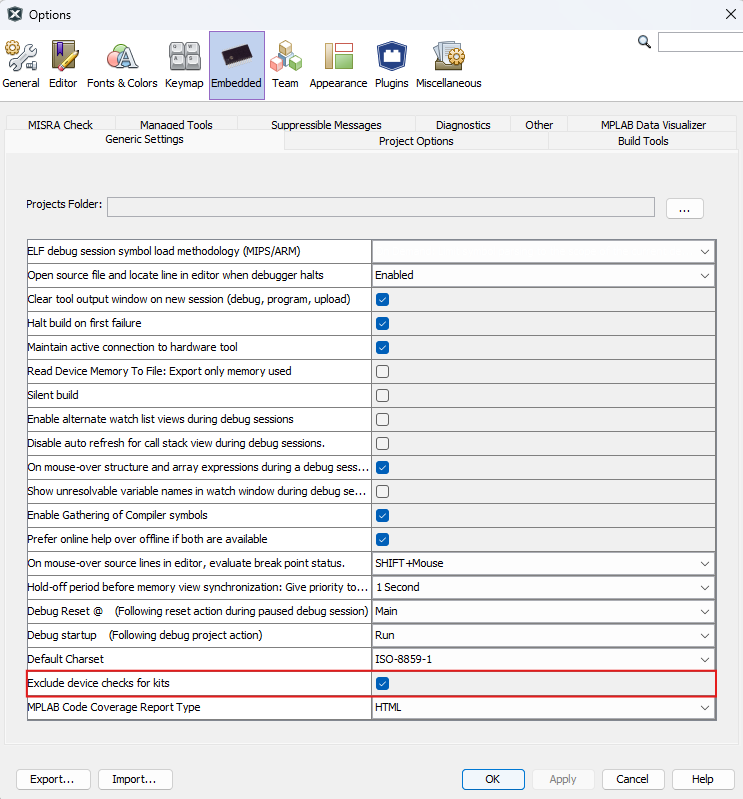
Using a Nano Debugger kit with External Microcontrollers
- Navigate to Tools > Options through the menu at the top of the application.
- Select the Embedded > Generic Settings category in the options window.
- Check the Exclude device checks for kits option.
10.6 Microchip Studio
The Nano Debugger is supported in Microchip Studio when used with devices that are supported by Microchip Studio and distributed through the Pack Server. This includes many AVR devices with a UPDI interface and some SAM devices.
Microchip Studio is "mature" and not recommended for new designs.
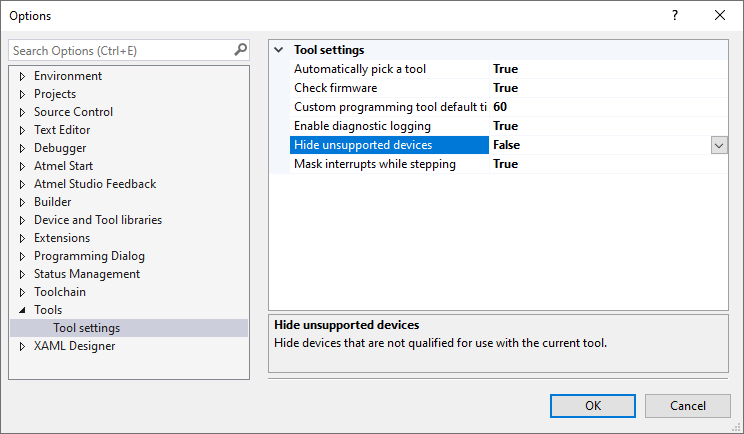
Using a Nano Debugger kit with External Microcontrollers
To program and debug a different microcontroller than the one mounted on the board, configure Microchip Studio to allow an independent selection of devices and programming interfaces.
- Navigate to Tools > Options through the menu at the top of the application.
- Select the Tools > Tool settings category in the options window.
- Set the Hide unsupported devices option to False.
10.7 Using Other Hardware Tools with a Nano Debugger Kit
When mounted as an on-board debugger on a development kit, the Nano Debugger allows for external tools to be connected. Such tools could offer additional features or better performance.
The Nano Debugger will not drive the debugger signal lines without instruction from an IDE.
10.8 USB Drivers
When a board with the Nano Debugger is connected to the computer for the first time, the operating system will install the driver software. The drivers for the Nano Debugger are included with MPLAB Tools for VS Code, MPLAB X IDE, and Microchip Studio.