
7 Data Gateway Interface (DGI)
Data Gateway Interface (DGI) is a USB interface that transports raw and timestamped data between the Nano Debugger and host computer-based visualization tools. MPLAB Data Visualizer is used on the host computer to display any debug GPIO data. It is available as a plug-in for MPLAB X IDE or as a stand-alone application that can be used in parallel with MPLAB® X IDE.
7.1 Debug GPIO
Debug GPIO channels are timestamped digital signal lines that connect the target application to a host computer visualization application. They are typically used to plot low-frequency events on a time axis, such as when specific application state transitions occur.
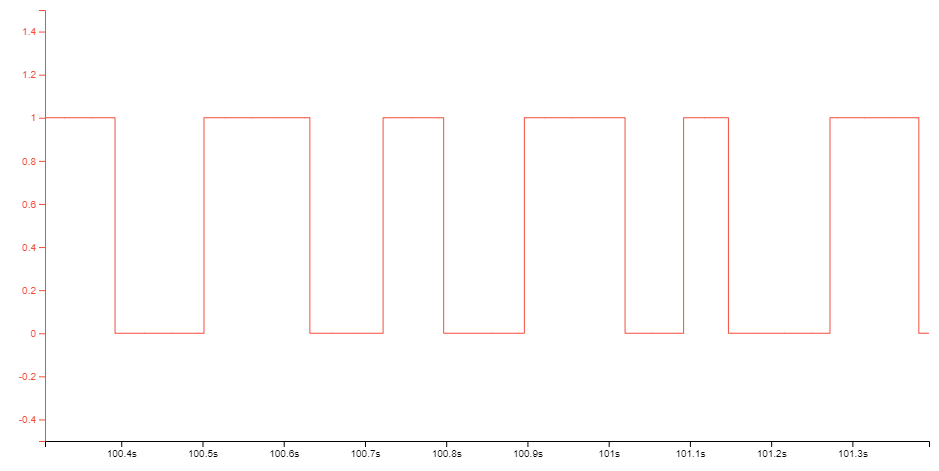
Debug GPIO channels are timestamped, so the resolution of DGI GPIO events is determined by the DGI Timestamp module resolution.
7.2 Timestamping
When captured by the debugger, DGI sources are timestamped. The timestamp counter implemented in the Curiosity Nano debugger increments at a frequency of 2 MHz, providing a timestamp resolution of half a microsecond.