
4.4.1 Flexible Second-Order Component Computation
Using the filter design tool (Excel spreadsheet) available in the MPLAB® Mindi™ Analog Simulator Software Library (see the Appendix), we calculated a 20 kHz low-pass Butterworth filter. The filter is set for maximum gain. The supply voltages and operational amplifier limitations regarding rail-to-rail operation are taken into account. This circuit is for demonstration purposes and ignores any additional circuitry related to the receiver’s AC coupling. The simulation bench is available as the file 2nd_order_LP_active_filter.wxsch in the Library.
Compared to the static maximum gain computed using the Excel spreadsheet, the gain was slightly reduced to account for the small overshoot in the step response, as the quality factor is greater than 0.5. This is achieved through Step 2 inputs, as well as by choosing capacitor values that are easier to find (while complying with the constraint on C2/C1 from Step 1 outputs and with the penalty of lower resistor values).
| Parameters | Value | Unit | Warnings/Suggested Normalized Values | ||||
|---|---|---|---|---|---|---|---|
| Step 1 | Inputs | Fc (Hz) = | 20000 | Hz |
WARNING: Q>0.5 generates a peak in the step response that must be taken into account in the max gain computation to avoid saturating the amplifier output. Reduce the global gain according to the step overshoot and check the transient simulation results. | ||
| Q = | 0.71 | ||||||
| INmin = | 0 | V | |||||
| INmax = | 3.3 | V | |||||
| OUTmin = | 0.05 | V | |||||
| OUTmax = | 4.95 | V | |||||
| V1 = | 5 | – | |||||
| Channels count = | 1 | – | |||||
| Capacitors series = | 12 | – | |||||
| Resistors series = | 96 | – | |||||
| Outputs | No sat. |G|max = | 1.48 | – | ||||
| Resonance freq = | NONE | Hz | |||||
| Extra gain @Fr | 1.00 | – | |||||
| Step overshoot = | 1.04 | – | |||||
| Min(C2/C1) = | 4.97 | – | |||||
| Suggested C1 = | 2.20E-10 | F | |||||
| Suggested C2 = | 1.20E-09 | F | |||||
| Step 2 | Inputs | Select |G| = | 1.4 | – | |||
| Select C1 = | 2.20E-10 | F | |||||
| Select C2 = | 2.20E-09 | F | |||||
| Outputs | Min(C2/C1) = | 4.80 | – | ||||
| Computed R0 = | 7.13E+03 | Ω | Nearest value from R0 in E96 series = | 7150 | Ω | ||
| Computed R1 = | 1.83E+04 | Ω | Nearest value from R1 in E96 series = | 18200 | Ω | ||
| Computed R2 = | 5.09E+03 | Ω | Nearest value from R2 in E96 series = | 5110 | Ω | ||
| Computed R4 = | 3.56E+04 | Ω | Nearest value from R4 in E96 series = | 35700 | Ω | ||
| Computed R5 = | 5.32E+04 | Ω | Nearest value from R5 in E96 series = | 53600 | Ω | ||
| Computed C4 = | 7.47E-07 | F | Nearest value from C4 in E12 series = | 680 | nF | ||
The theoretical maximum gain obtained by mapping the input range to the output range (1.48 in this case) is reduced to account for the dynamic behavior during transients, as the expected overshoot is a factor of 1.04 for Q=0.707.
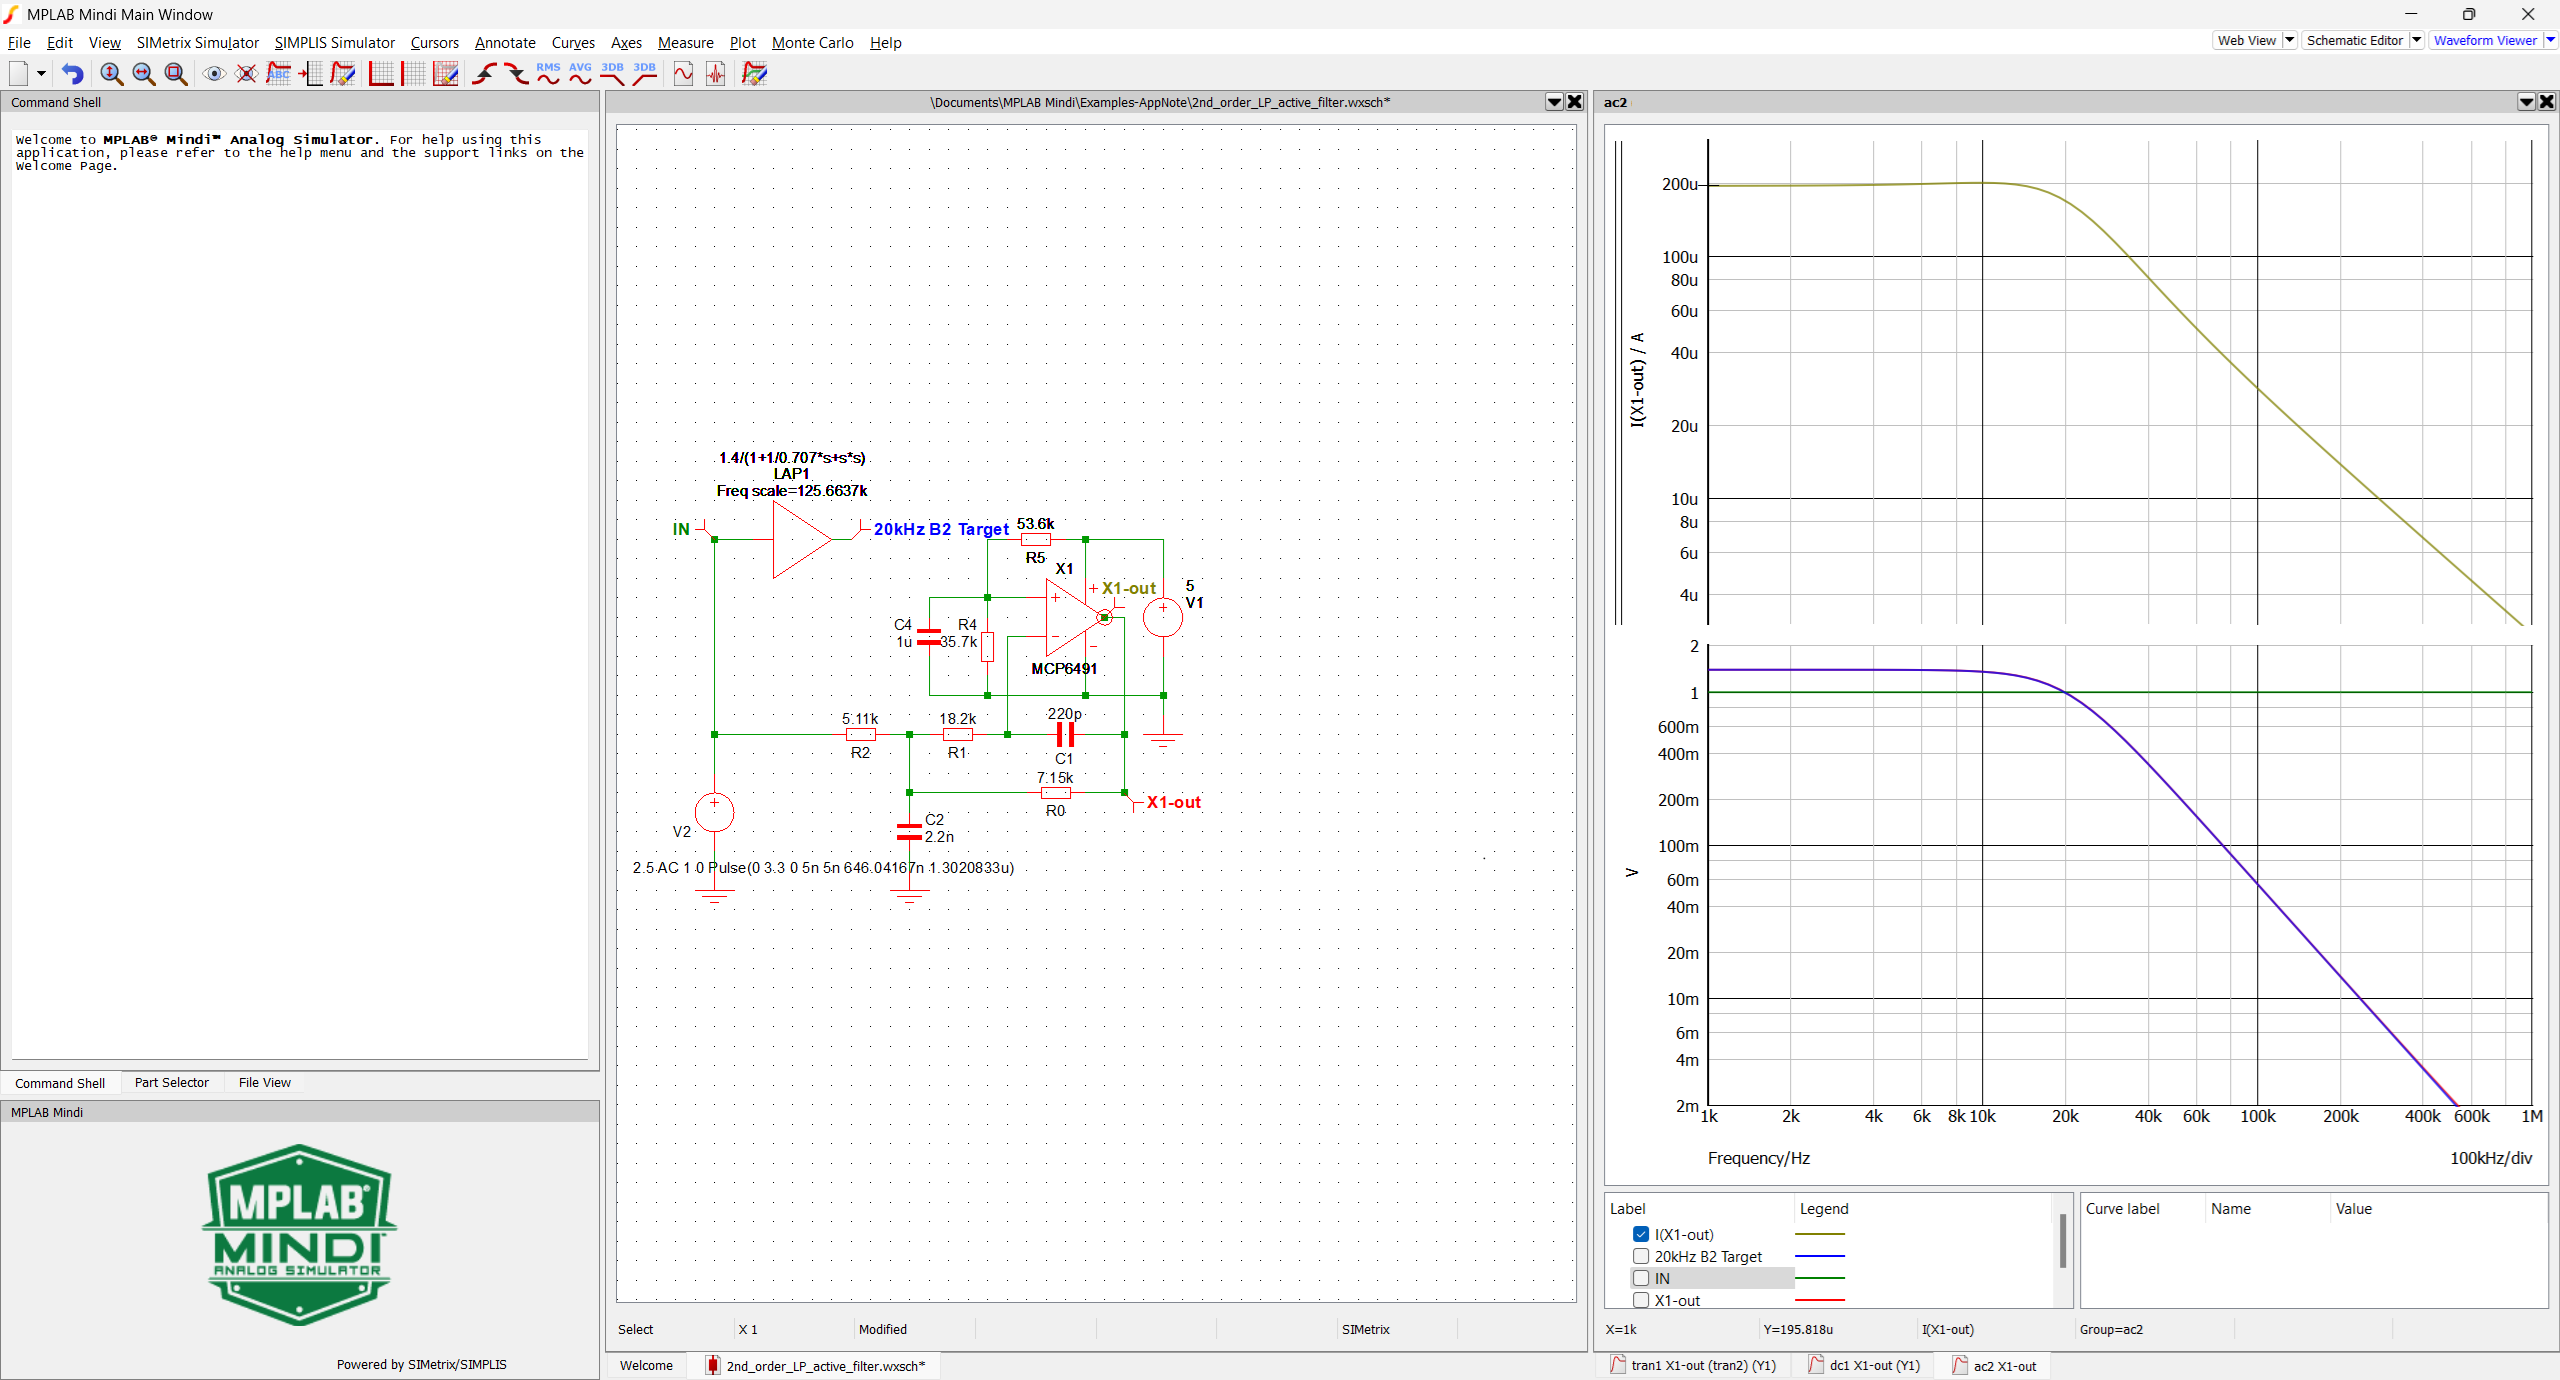
C4 is larger than the computed value. The calculation targets a 10 Hz high-pass filter. Implementing a lower corner frequency generally has no practical consequence, and a 1 µF capacitor is more common.
The AC simulation demonstrates a good match between the designed filter and the ideal filter. The blue and red curves are superimposed. The AC current is moderate across the whole frequency range compared to the operational amplifier capability.
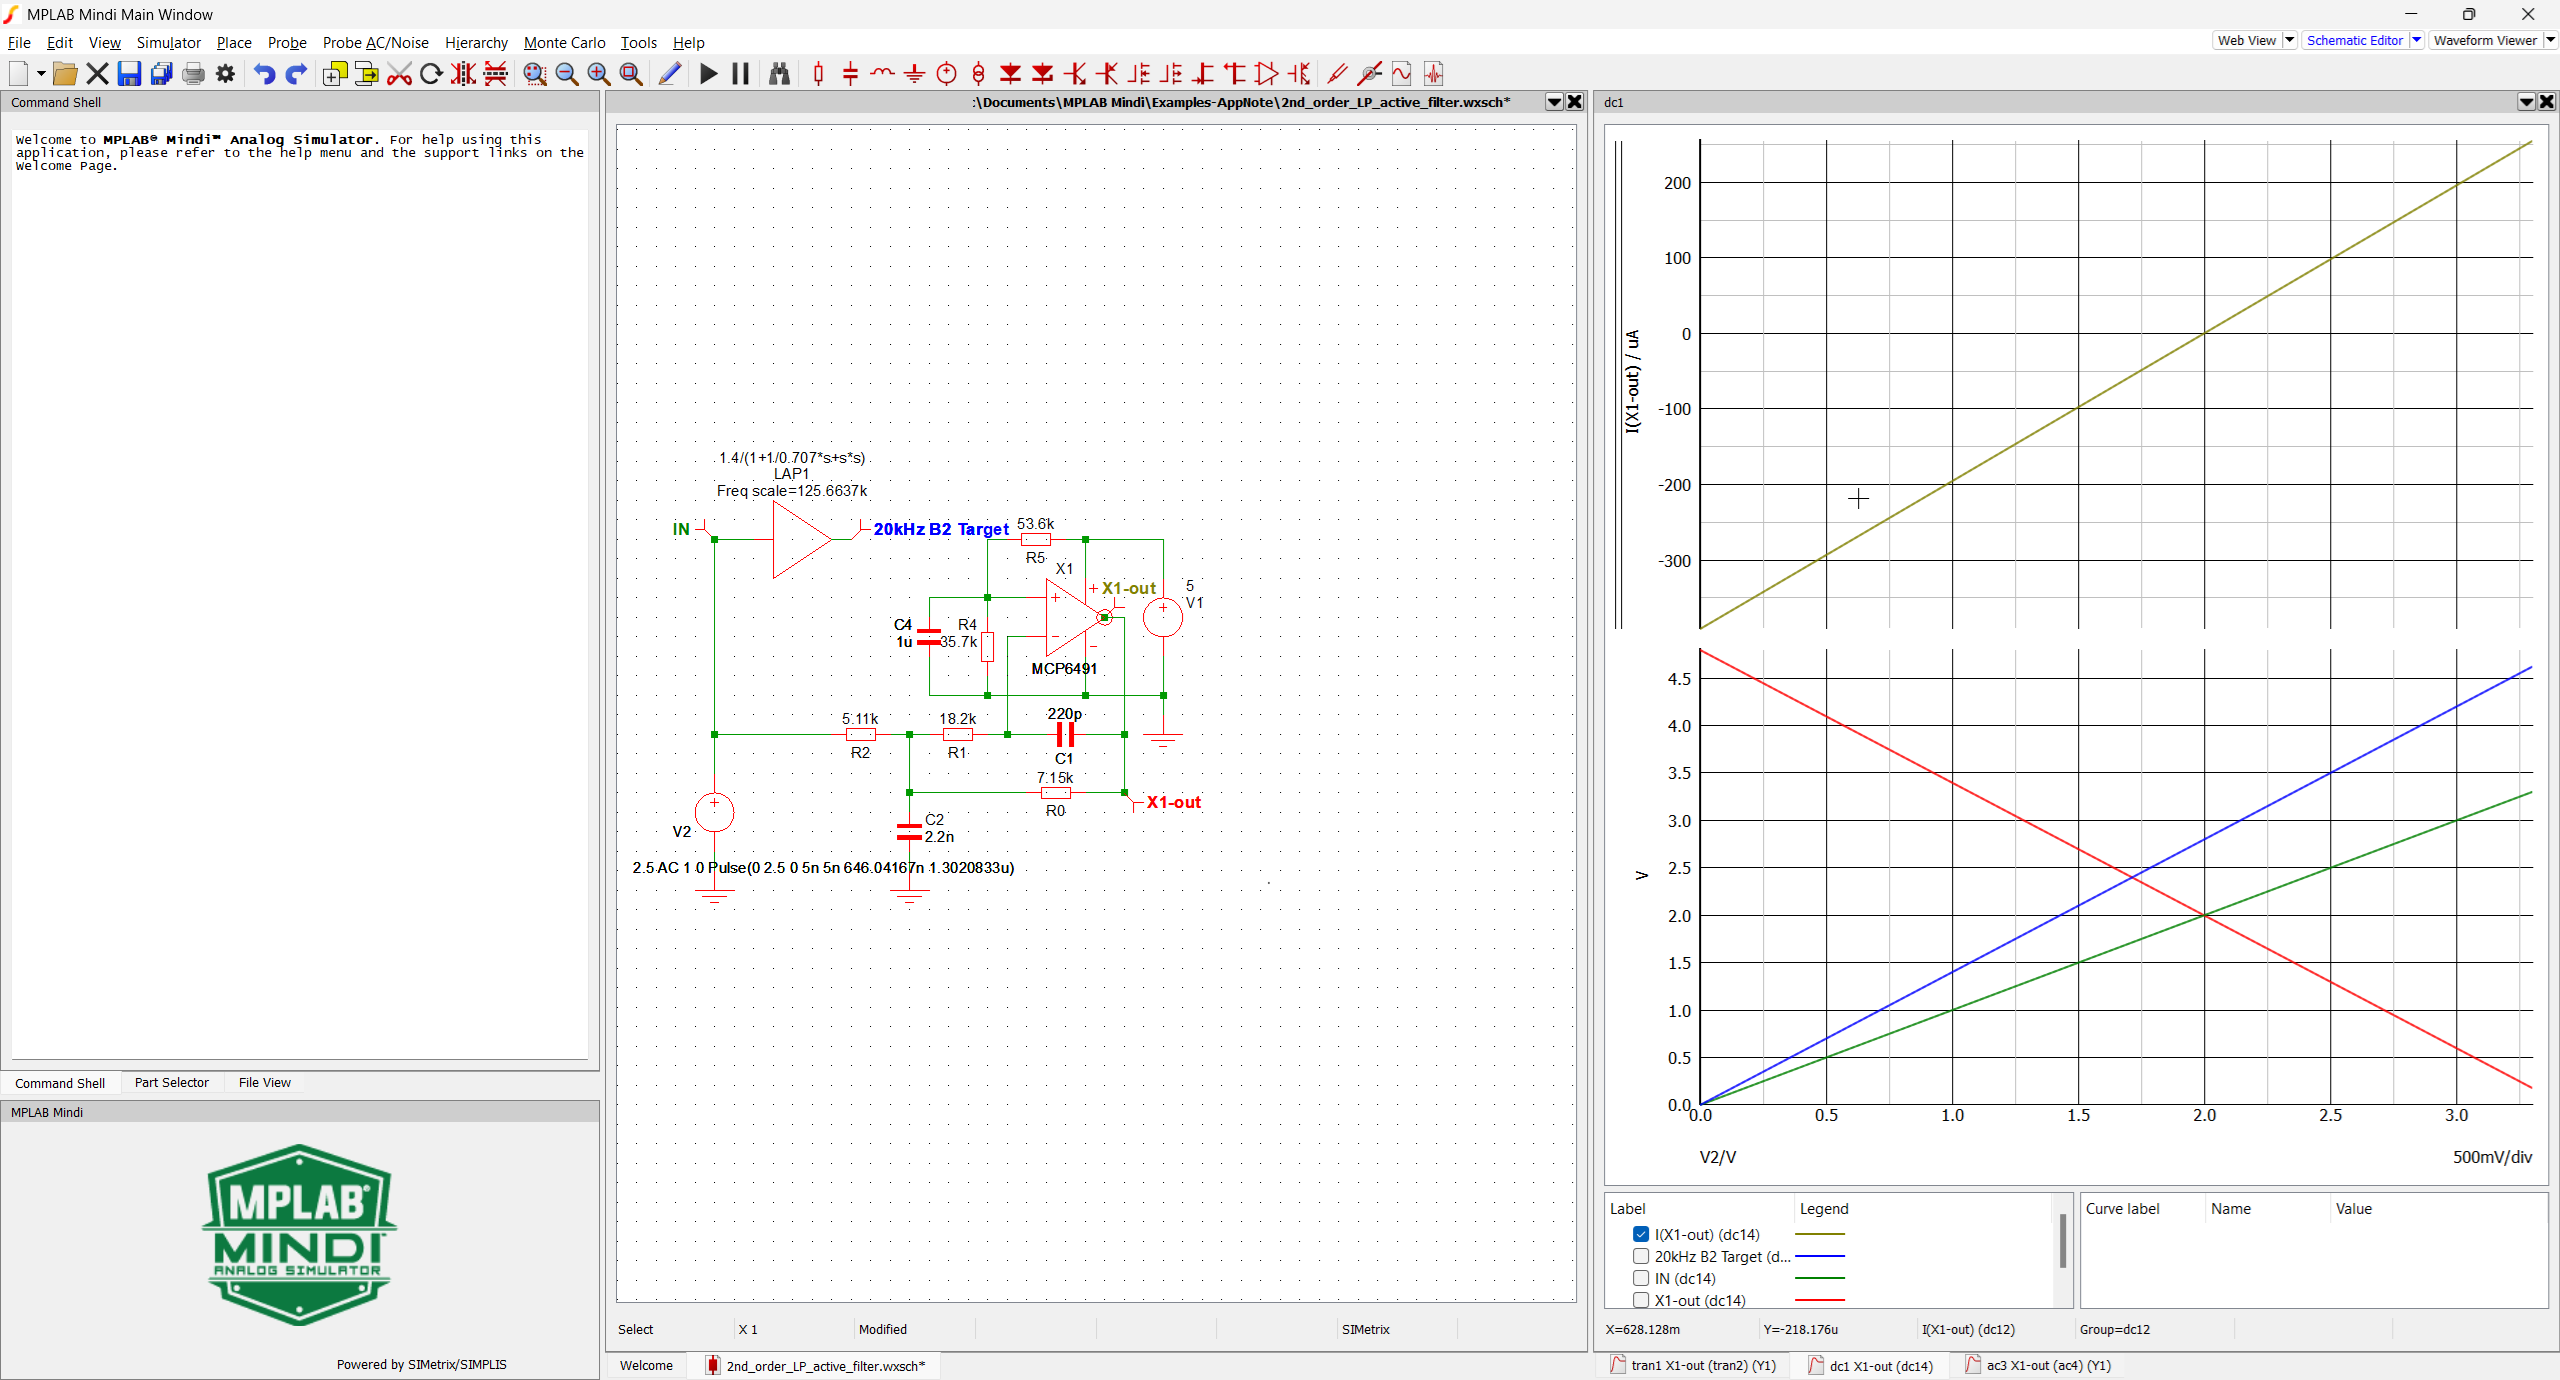
The DC simulation results show the output range (red curve) versus the input range (green curve). There are ~200 mV margins between the output range and the supplies on both sides. Since the output always includes a DC component, it is necessary to add an AC coupling to the receiver. The impedance observed from the amplifier positive and negative inputs is matched. For a stereo setup, use option 2 for the channel count to compute a single set (R4, R5, C4) that can be shared between the two amplifiers.
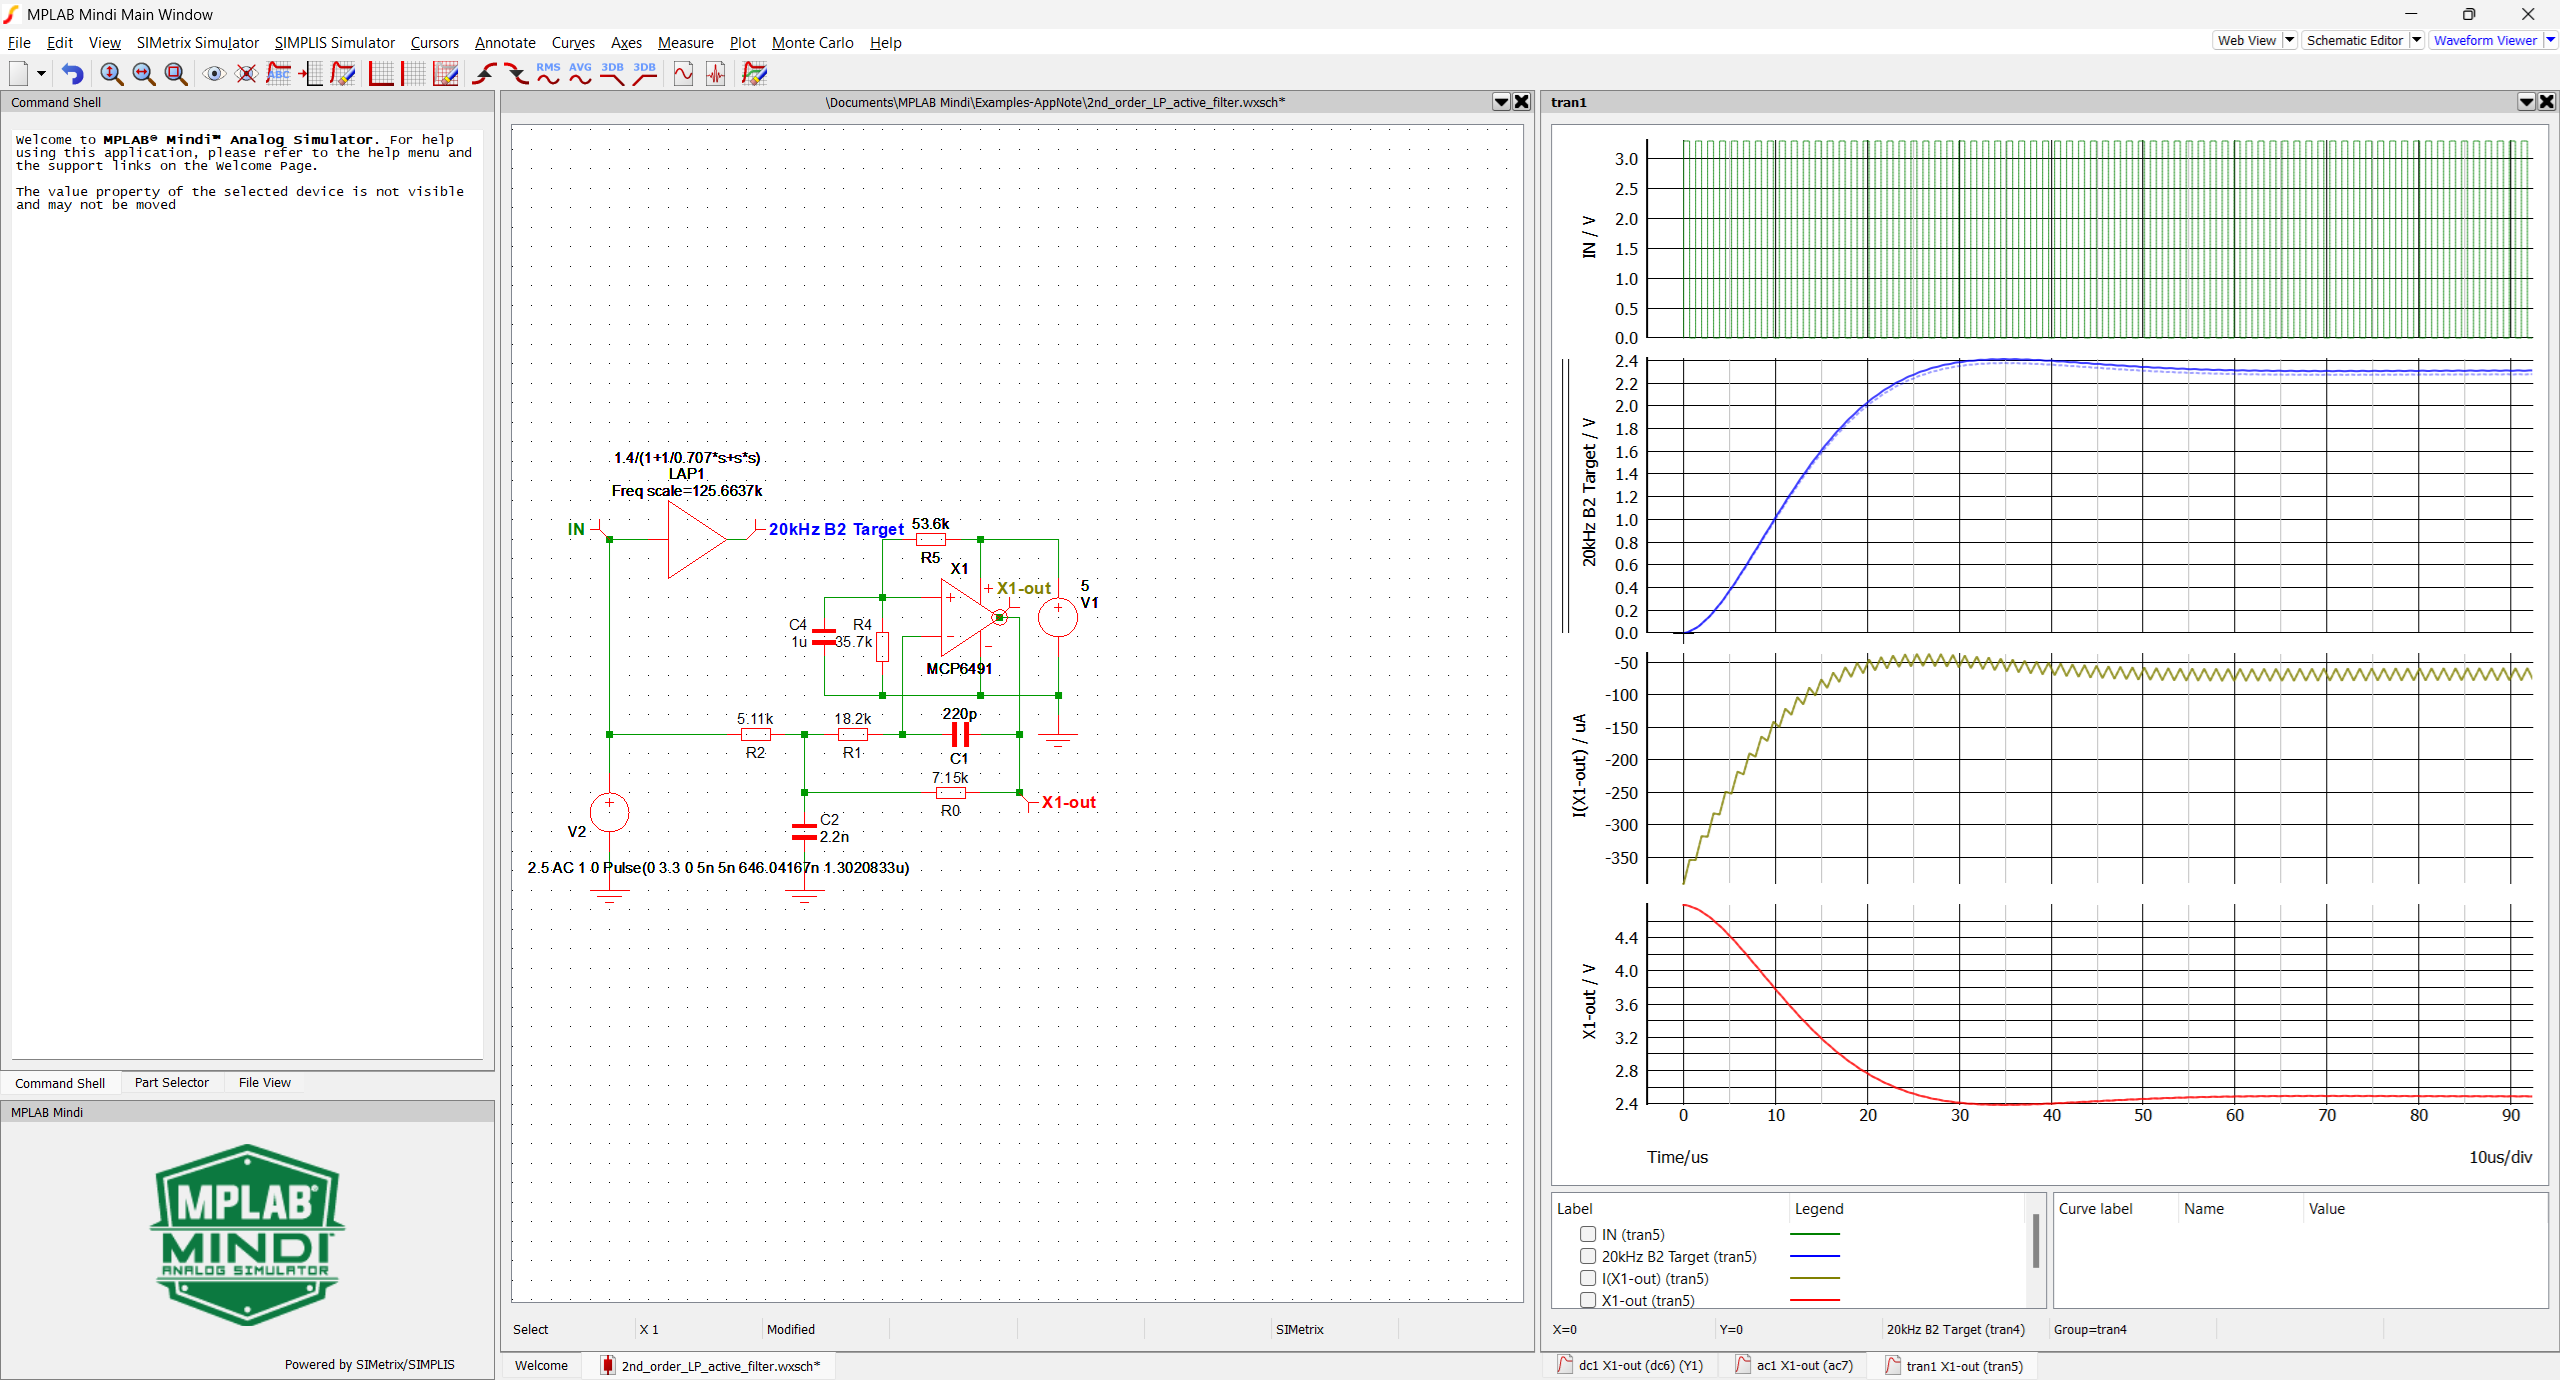
The transient simulation shows the step response with moderate overshoot (~100 mV), in accordance with the computed 1.04 factor. A residual ripple from the PWM is visible on the output voltage.