
4.8.2.1.6 Graph
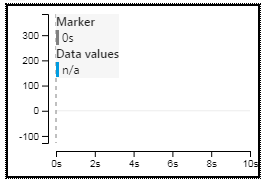
The Graph widget plots the incoming data streams in a two-dimensional graph. The graph can be configured to accept zooming and scrolling by mouse interaction or to be static ignoring any mouse interaction.
Data Fields
Add a data source to the plot as with a Time Plot.
Configuration
See View Data in the Time Plot.
Note: In dashboard Edit Mode, some of the functions and UI
elements of the graph widget are disabled in order to minimize interference with
mouse events related to positioning the widget. In dashboard View Mode, all graph
functions work normally.