4.4.2.3 Zoom In
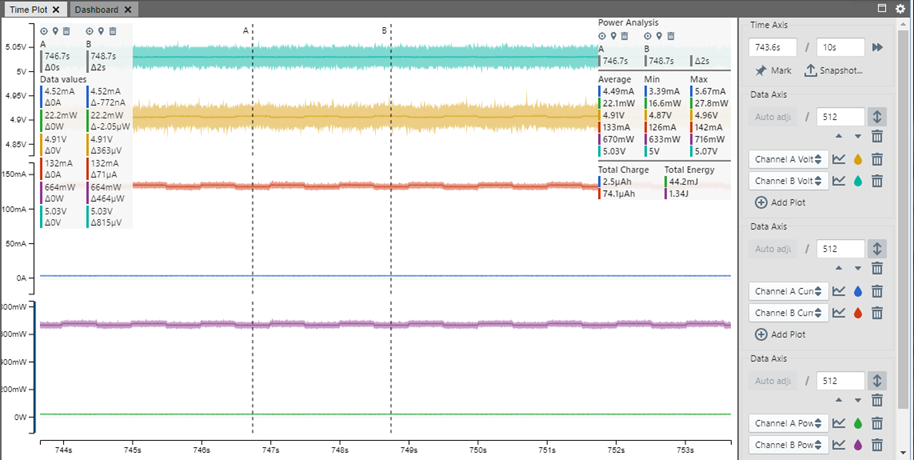
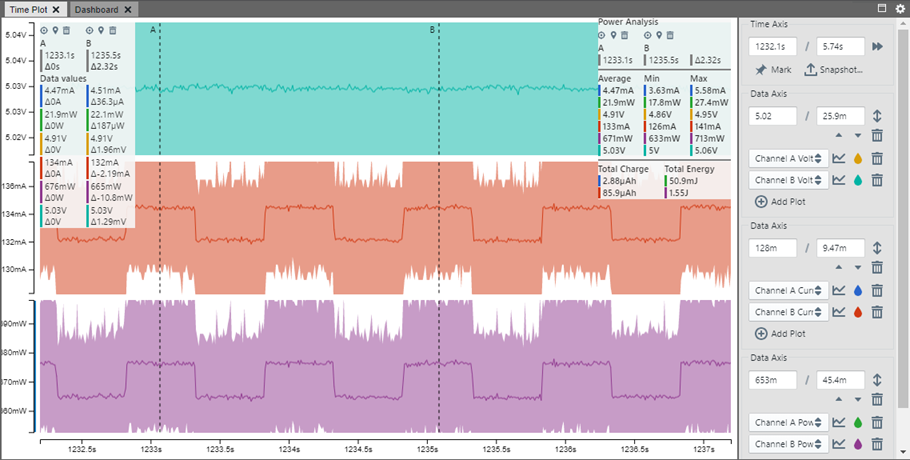
The MPLAB Data Visualizer will show two power measurement plots for each graph. One is for the ATmega4809 device and the other is for the target board. Although you can use the Power Analysis option to help understand the data, it is difficult to see the plots clearly.

To better see the plots, it may be useful to zoom in on the plots for each channel. Move the mouse cursor to the plot value axis and use the wheel to zoom in and out.
For more about noise in the plots, see Noise in Power Plots.

