4.4.2.2 Debug and Visualize
The application used for the target is based on Example 2 from these code examples:
MPLAB XC8 User's Guide For Embedded Engineers AVR Code Examples
To use the code for the ATmega4809 Xplained Pro instead of the Atmega4809 Curiosity board, change “PORTD” to “PORTB” in the code.
To do:
- Open Example 2 in MPLAB X IDE v5.50 or later.
- Make the code changes specified.
Open the MPLAB Data Visualizer in MPLAB X IDE.
To do:
- Select Window>Debugging>Data Visualizer. This will open the MPLAB Data Visualizer.
- The Data Visualizer should find the
Power Debugger DGI interfaces. Click on the Power Source options icon
 and
then enter Power Settings. Click on the icon again to save settings and close.
and
then enter Power Settings. Click on the icon again to save settings and close.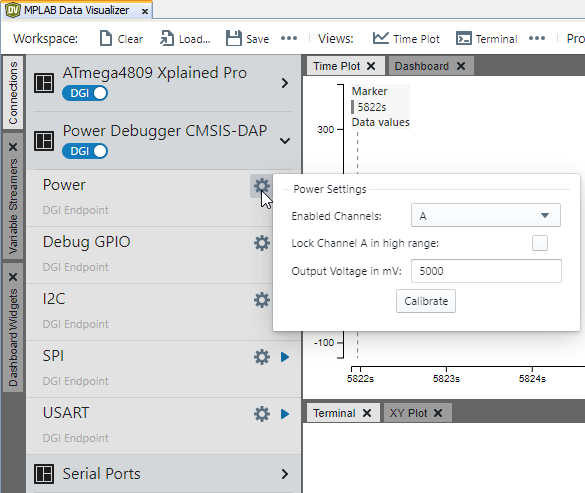
- The Data Visualizer should find the ATmega4809 Xplained Pro as it is now powered. However, only Power Debugger connections will be used.
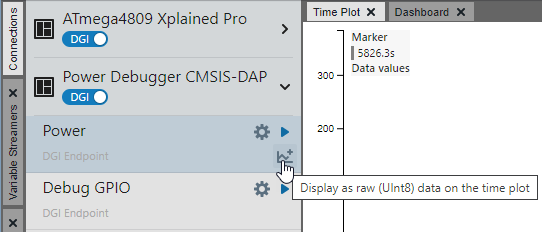
Now the example can be debugged and the output plotted in the visualizer.
To do:
- Debug the example. The User LED will flash on the Xplained Pro board when running.
- On the Power interface, select to
display all sources on the time plot.