4.7.1 Dashboard Window
The Dashboard window is an area onto which widgets or data sources can be dragged and used to control or display application parameters. Available widgets are shown on the Dashboard Widgets Tab.
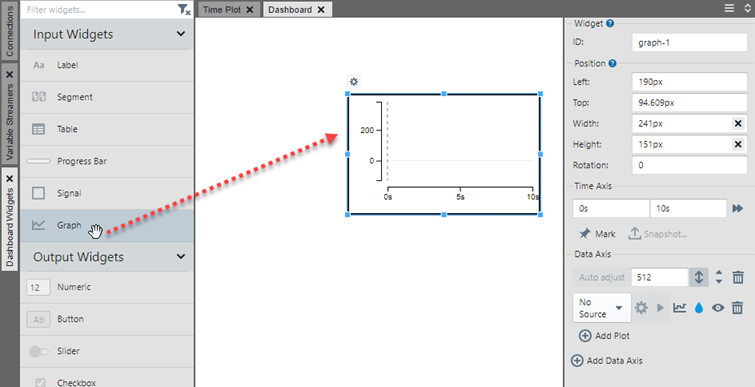
As an example, dragging the Graph (Input Widget) to the Dashboard results in widget graph-1 which may be set up by dragging the graph handles to resize and/or using the Widget Control Pane.
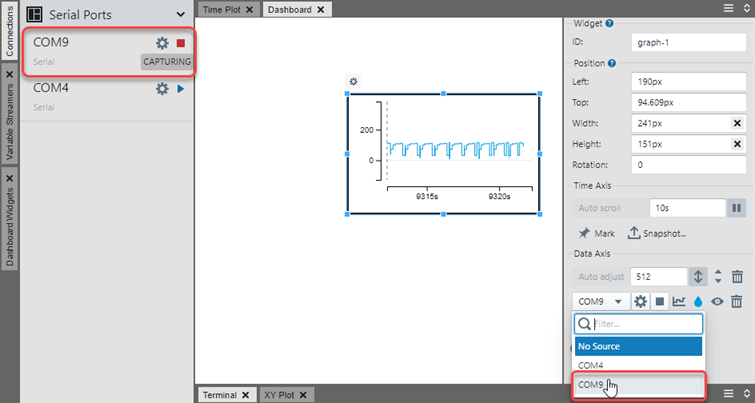
Click on the Connections tab to find the data source you want to connect to the widget. Then in the configuration panel, select that option from the drop down list.
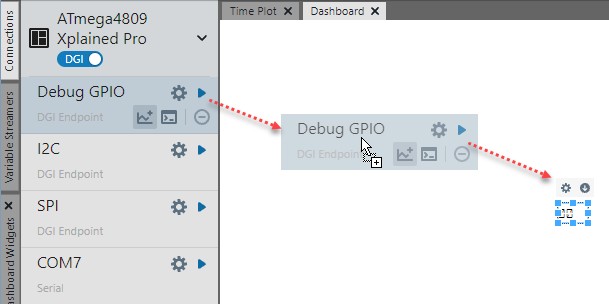
Sources and variable streamer fields may also be dragged onto the window and will display as a Segment widget (see figure below). The segment will be automatically associated with the data source.
A streamer group will display as a Table widget. When Debug GPIO is dragged onto the Dashboard as in the figure, the widget will show the GPIO bus value. Individual GPIO lines can be selected from the source drop down list. When Power is dragged onto the Dashboard, the widget will show Channel A Power. Other power data fields can be selected from the source drop down list.