
2.4.4 Application Testing: Debugging
One way to test the functionality of an application is by going step by step through it and check that all the implemented instructions are providing the expected result.
SYSTEM_Initialize(); function call in the main
function. Enter the Debug mode. 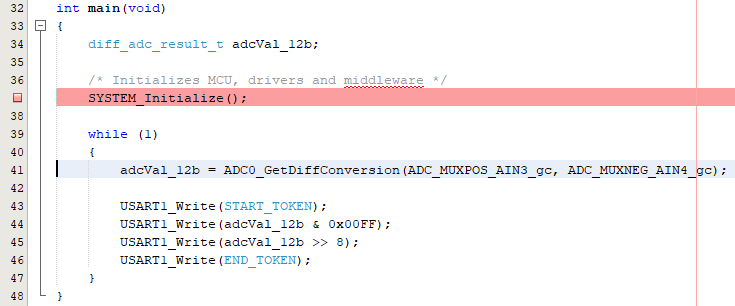
To visualize the content of the registers, go to Window → Debugging and select IO View. This will open the IO View window. To start debugging, go to Debug and select Debug Main Project. The program execution will stop at the breakpoint line.
After clicking the Step Over button, the user can check, for example, if the ADC peripheral was initialized as desired, by looking into the registers in the IO View window. The registers from the IO View window are presented in Figure 2-24.
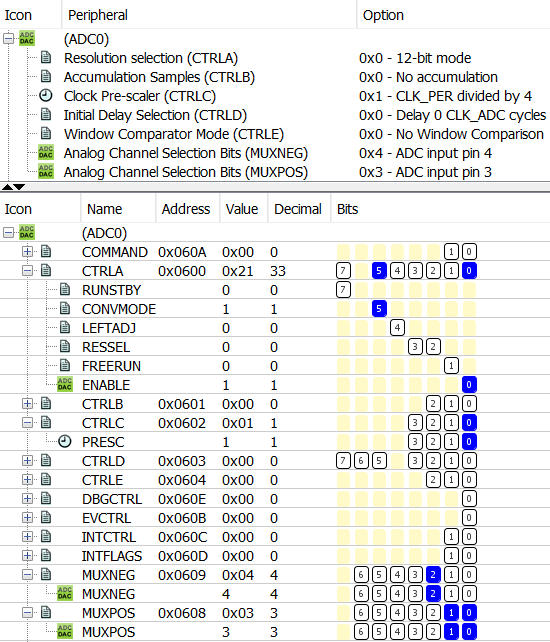
By going step by step through the application, the user can see:
- The conversion result in the ADC Result (RES) register
- The data that needs to be transmitted through USART – in the TXDATAL register
- The value of the adcVal variable, using the Variables window