
2.4.5 Application Testing: Data Visualizer
The application can be easily tested by using the MPLAB Data Visualizer. To plot the ADC results transmitted through USART, the following steps must be implemented:
- To open the Data Visualizer plug-in,
click on the plug-in icon, as presented in Figure 2-25.
Figure 2-25. Open Data Visualizer 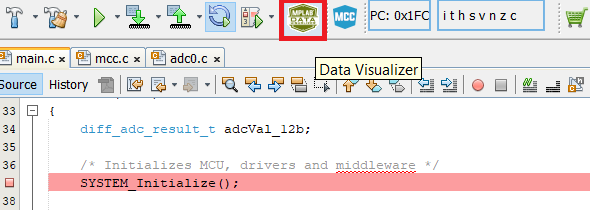
- From the Connections tab,
select the Curiosity Nano communication port (COMn) drop-down list, as
presented in Figure 2-26.
Figure 2-26. COMn Port – Display Drop-Down List 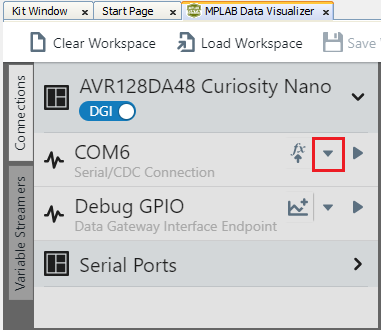
- From the drop-down list, select
New variable streamer..., as presented in Figure 2-27.
Figure 2-27. COMn Port – Select from Drop-Down List 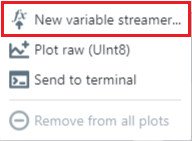
- Select a Variable Streamer
Name, add the variables that will be received, and click Next.
Figure 2-28. Configure Variable Streamer 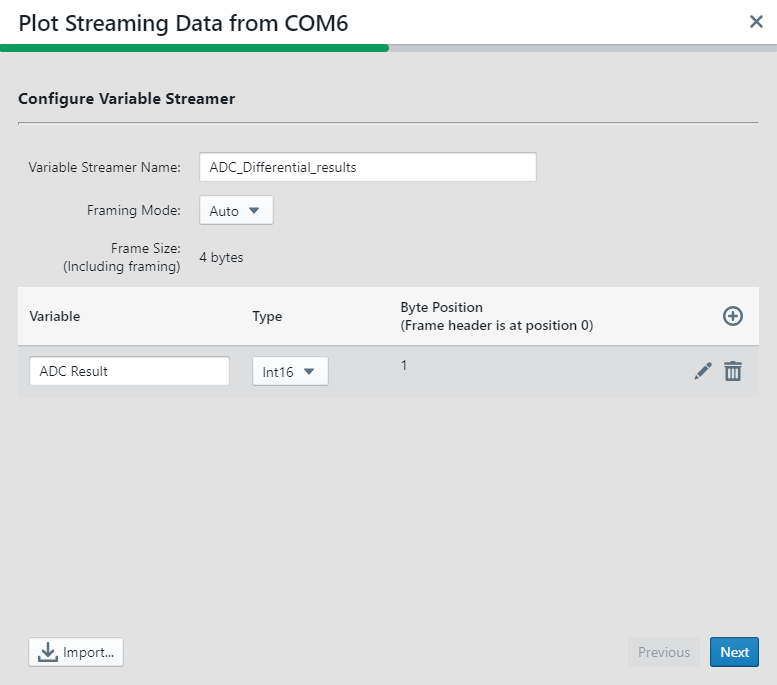
- Choose the variables to be plotted by
selecting the desired variables, and select New axis per data type (1) for
how to plot the data. Then, click Finish.
Figure 2-29. Choose Variables to Plot 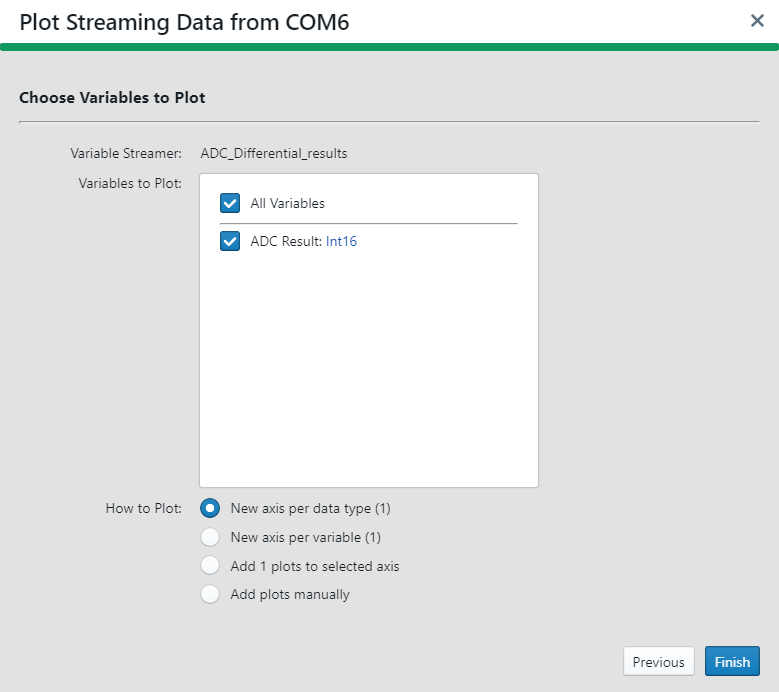
After randomly turning both potentiometers, the plot was obtained. The ADC results are presented in Figure 2-30.