To view Program Counter samples
together with current measurement data both the Power interface
and the Code Profiling interface must be enabled.
Todo:
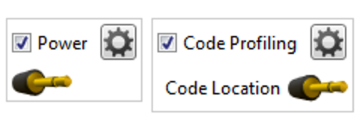
Enable both
Power interface and Code
Profiling interface in DGI Control
Panel
Todo:
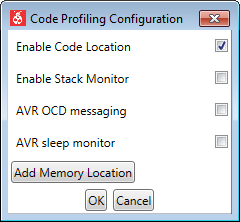
Open the Code
Profiling Configuration dialog by clicking the Gear
button on the Code Profiling interface
Select Enable Code
Location
The online versions of the documents are provided as a courtesy. Verify all content and data in the device’s PDF documentation found on the device product page.