3.2.11.2 Run
- Start a Data Visualizer session and let it run
- Perform a disk format and capture the resulting plot
- Stop the session or disable auto-scrolling
- Switch off GPIO 2 and 3
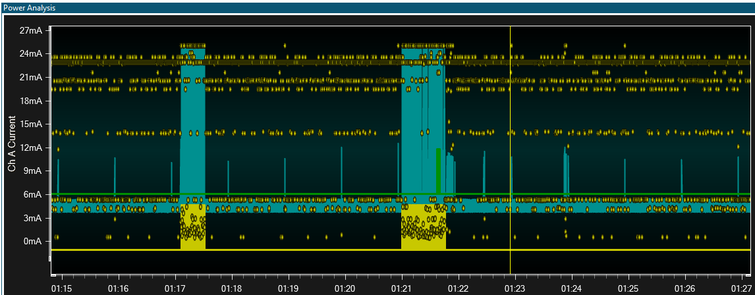
Zooming in on the format activity identified previously, you should see a plot like this:

The yellow points plotted on the graph represent polled Program Counter values. Their location on the y axis is a visual representation of their location in the code-space of the target device. The relative grouping of samples shows us execution of different functions. Patterns can easily be seen using this technique. Notice how the format activity (as seen by GPIO activity) has a different distribution of Program Counter values compared to the parts with no GPIO activity.
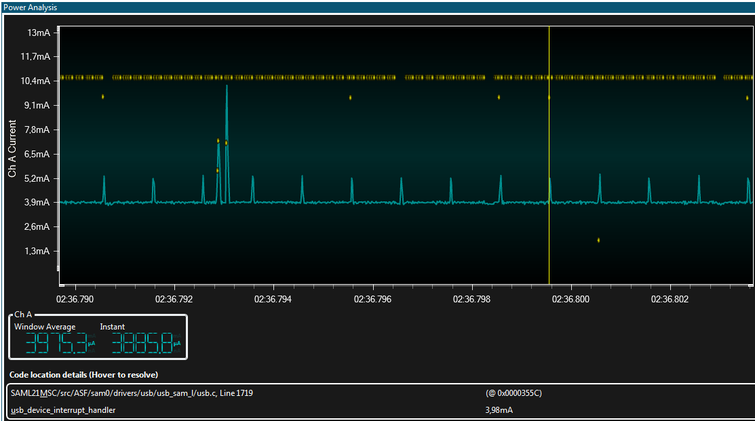
Hovering over one of the samples shows the location of that sample in the Code Location Details box below the graph, as well as the value of the current consumption sample at that point.
Zooming in on one of the larger current peaks, we might see something like this:

The smaller current spikes are very regular and occur every millisecond. Some of these have Program Counter sample values resolved as usb_device_interrupt_handler, which confirms this is a USB millisecond tick pulse waking the CPU briefly. The interrupt is executed too quickly to be caught on all executions. The larger current spikes are often associated with another USB function (csw_send / receive).
Double clicking on one of the Program Counter samples will open the editor and highlight the line corresponding to that sample.
