
5.1.4 Signal Connections File Format
A signal connections file has the file extension .sc and it specifies the connections between the data stream sources defined in a .ds file and the GUI elements in the Dashboard defined in a .db file. The .sc file format is a comma-delimited text file specifying one connection per line. Each line follows the format <Stream name>, <Element ID>. The Stream name is defined in the .ds file and is the text string assigned to each data variable. The Element ID is defined in the .db file for each Dashboard Element.
An example of a .sc file content:
                Plane,0
                Delta1,2
                Delta2,2
A stream called Plane is connected to an Element with ID 0 and both streams Delta1 and Delta2 are connected to an Element with ID 2. For a full auto-configuration example, see Auto-Configuration Example.
The Table Element (see Table) has some extra parameters in addition to the Stream name and Element ID. The column and row of the cell to connect the signal to is given by appending (Column:<column number>;Row:<row number>) to the lines in the .sc file. The upper left cell is specified by column 0 and row 0. As an example the table
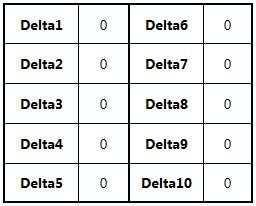
is connected to sources by the following .sc file content:
Delta1,2(Column:1;Row:1)
Delta2,2(Column:1;Row:2)
Delta3,2(Column:1;Row:3)
Delta4,2(Column:1;Row:4)
Delta5,2(Column:1;Row:5)
Delta6,2(Column:1;Row:6)
Delta7,2(Column:1;Row:7)
Delta8,2(Column:1;Row:8)
Delta9,2(Column:1;Row:9)
Delta10,2(Column:1;Row:10)
Note that in the example the Table element is in Auto-Labels mode so each cell has two fields; a label to the left and the actual data to the right. For more information, see Auto Labels.
The Graph Element (see Graph) also supports an extra parameter in addition to the Stream name and Element ID. By default, all plots are visible in the Graph element but they can be hidden or shown by the user clicking the legend in the Graph view corresponding to a plot. The extra parameter supported makes it possible to change the default behavior to hide plots when doing auto-configuration. This is done by appending (visible:0) to the .sc file. As an example, see the following .sc file
Delta1,2(visible:0)
Delta2,2
Delta3,2(visible:0)
Delta4,2
Delta5,2
Delta6,2
Delta7,2(visible:0)
Delta8,2(visible:0)
Delta9,2
Delta10,2
results in the graph element looking like this:
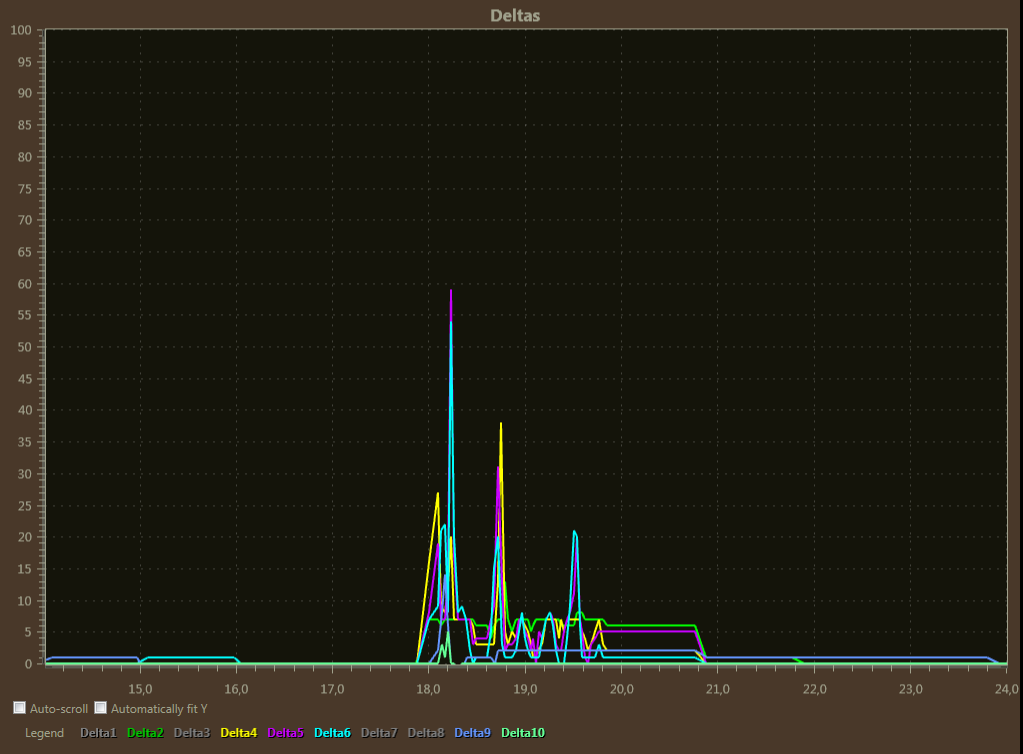
In the graph the plots named Delta1, Delta3, Delta7, and Delta8 are all hidden and the legends are gray. The user can enable them by clicking the legends. In the same way the visible plots can be hidden by the user clicking the corresponding legends.