
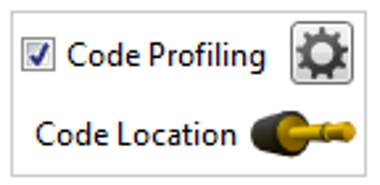
2.1.6.1 Code Profiling Interface
For a couple of examples on how to configure and use the Code
Profiling interface, see Data Polling Example and Program Counter Polling.
Important: The Code Profiling interface is only
available when Data Visualizer is run as an extension within Atmel Studio. This is
because it needs to access the debug system on the target device through the Atmel
Studio debugger backend.
The Code Profiling Configuration window can be opened after enabling the Code Profiling interface in the DGI Control Panel.
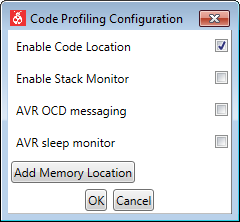
| Field Name | Values | Usage |
|---|---|---|
| Enable Code Location | ON, OFF | Controls the state of the Program Counter sampling. |
| Enable Stack Monitor | ON, OFF | Enables polling of the Stack Pointer to monitor stack usage (AVR® MCU with UPDI only) |
| AVR MCU OCD messaging | ON, OFF | Enables routing of OCD messages to Data Visualizer rather than Atmel Studio. |
| AVR MCU Sleep monitor | ON, OFF | Enables monitoring of the Sleep state of the MCU (AVR MCU with UPDI only) |
| Add Memory Location | Adds a new entry of memory location to poll and control. A text box for entering the address (hexadecimal), selecting data type and a Delete button will appear. |
Each configuration option is detailed in the following sections.