
4.5.2.1 DC Signal With Random Noise
- ADC2 computation mode: Accumulate mode
- Input signal: DC ~1V + Random noise 0.5V peak-to-peak
- Press push button S1 on the HPC board
- Verify the Computation mode number in Data Visualizer graph is 2
- Verify LED D2 is illuminated
- Configure Signal & Noise Generator board to generate a DC signal of ~1V and random noise with 0.5V peak-to-peak
- Verify the input signal using an oscilloscope
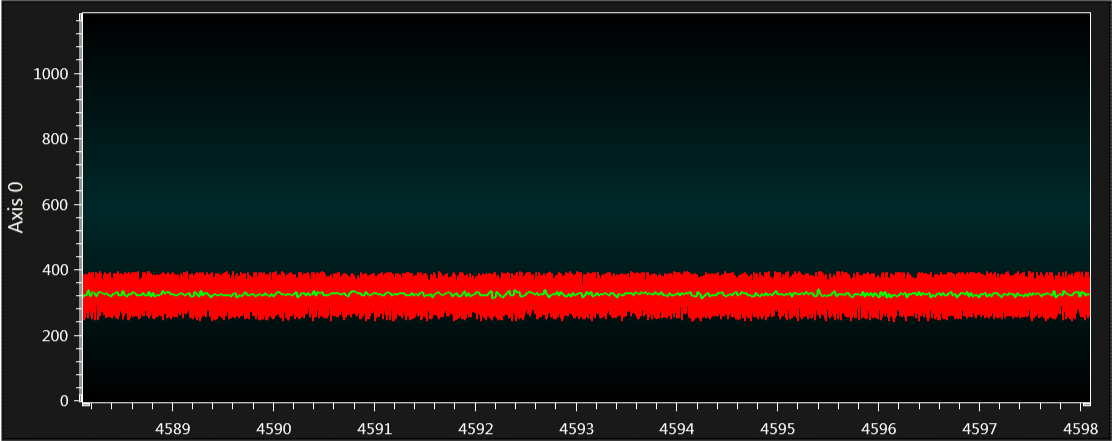
The Data Visualizer graph is as shown in Figure 4-7. The red colored signal is a noisy input signal (ADRES value), the green colored signal is a filtered signal (ADFLTR value).
From the graph, it can be seen that the noise has been suppressed using the ADC2 Accumulate mode. In the example source code the ADCRS bits are configured to 5. This means averaging is attained with 32 samples. The graph looks similar to the graph for the Basic mode. The advantage here is sample accumulation, and averaging handling is not needed in the code as the ADACC and ADFLTR registers are available.
If the signal is zoomed, the image is as shown in Figure 4-8.
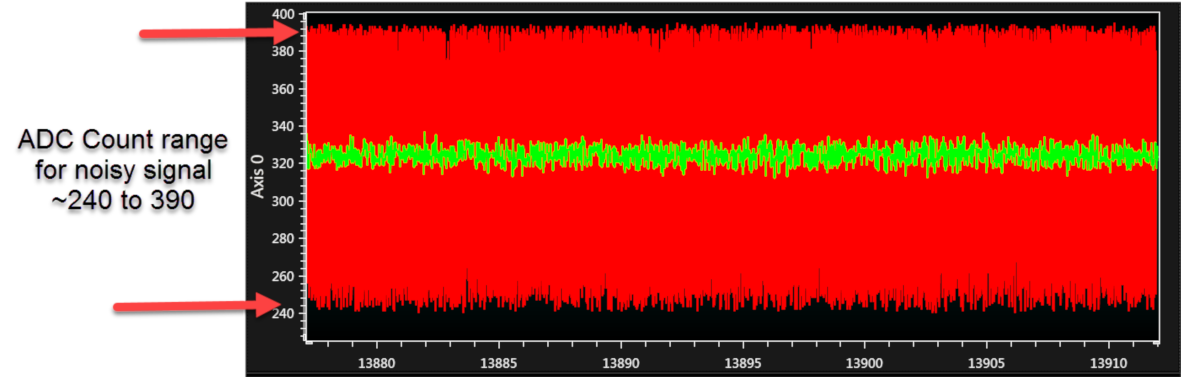
From the graph, the ADC count for a noisy signal (red colored signal) can be seen varying from 240 to 390 because of random noise. That means the ADC count is varying ±75 counts (390 to 240 → 315 ±75 counts).
The ADC count for a filtered signal (green colored signal) can be seen varying from 315 to 335. That means the ADC count is varying ±10 counts (335 to 315 → 325 ±10 counts).
Pros: Using this mode, the ADACC register gives accumulated values of up to 64 samples and the ADFLTR register gives an average value of all the accumulated samples so, software overhead can be avoided.
Cons: Determining the number of sample accumulation and clearing of ADACC registers needs to be handled in code.