
4.5.5.2 DC Signal With Random Noise
- ADC2 computation mode: LPF mode
- Input signal: DC ~1V + random noise 0.5V peak-to-peak
- Press push button S1 on the HPC board and verify the computation mode number in the Data Visualizer graph is shown as 5 and that LED D5 is illuminated
- Configure Signal & Noise Generator to generate a DC signal of ~1V and random noise with 0.5V peak-to-peak
- Verify the input signal using an oscilloscope
The Data Visualizer graph is as shown in Figure 4-18. The red colored signal is the noisy input signal (ADRES value), the green colored signal is the filtered signal (ADFLTR value).
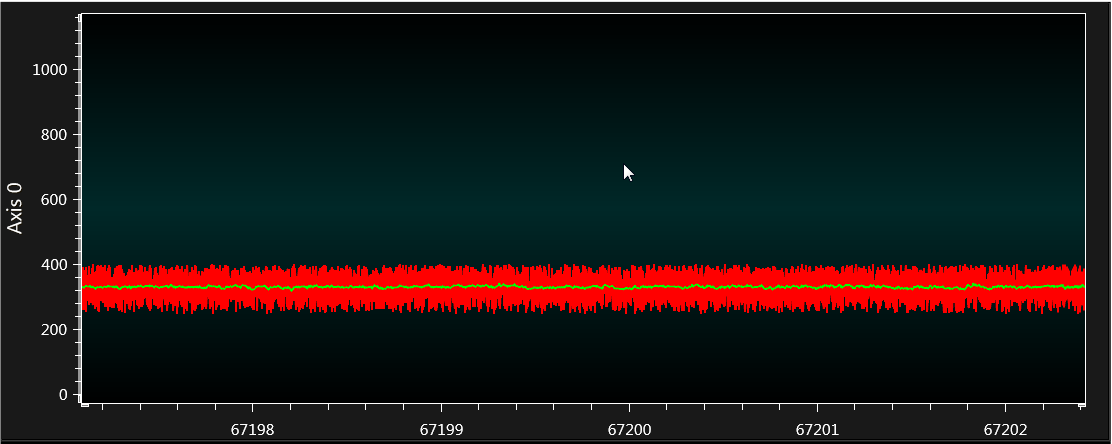
From the Figure 4-18, it can be seen that the noise has been suppressed using the ADC2 LPF mode. In the example source code the ADCRS bits are configured to 5. If zoomed in, the graph looks almost similar to the graph for Basic mode, Accumulate mode, and the Average mode where the ADC count of the filtered signal can be seen as ~ 315 to 340.
In LPF mode, a new ADC result is available in ADFLTR with every new sample, while in Average mode a new filtered value is available every 2ADCRS sample.
The ADCRS can be configured from 1 to 6 for LPF mode. When the signal is noisy, the ADCRS value determines how drastically the filtered output changes. When the ADCRS value is higher (e.g. '5' or '6'), sudden changes in the input signal have less of an influence on the output signal. Conversely, when the ADCRS value is lower (e.g. '1' or '2'), sudden changes in the input signal are also observed in the output signal. It means when ADCRS = 1, noise has a significant impact on the output signal. When ADCRS = 6, noise has much less of an impact on the output signal.
Pros: The LPF mode suppresses noise from a DC signal by taking a continuous running average of samples without software overhead.
Cons: The ADCRS bits act as an RC time constant and it can be configured from 1 to 6. As the ADCRS value increases, the time it takes for the filtered output to achieve a steady state increases, but the effects of any deviations from the overall average have less of an impact on the filtered output.