
2.3 Using the Simulator Logic Analyzer
The simulator logic analyzer allows you to graphically view digital signals over a defined time period. Open the logic analyzer window from Window>Simulator>Logic Analyzer.
Logic Analyzer Setup
Either pin or bus (containing one or more pins) data over time may be displayed in the window. Click on the Settings button to open the Settings dialog where you can select pins or buses. Hover the mouse over a button to see its definition.
 | Settings |
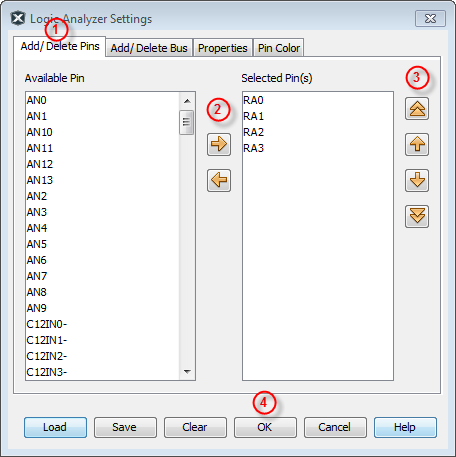
To select pins:
- Click the “Add/Delete Pins” tab.
- Use the right and left arrow icons to add (choose) or delete (remove) pin(s). Hover the mouse over a button to see its definition.
- Use the up and down icons to select the display order of the pins in the window.
- Click OK to add the pin(s) to the Logic Analyzer window.
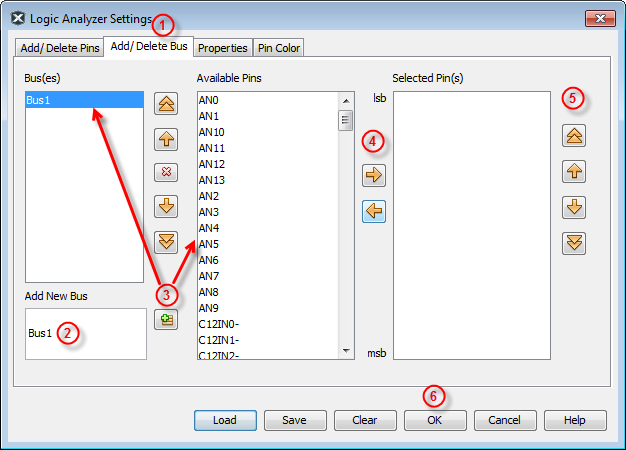
To select buses:
- Click the “Add/Delete Bus” tab.
- In the “Add New Bus” text box, enter a name for a new bus.
- Click the “Add New Bus” icon next to the text box. The new bus name will move under “Bus(es)” and a list of available pins will appear under “Available Pins”.
- Use the right and left arrow icons to add (choose) or delete (remove) pin(s). Hover the mouse over a button to see its definition.
- Use the up and down icons to select the order of the pins in the bus. Pins should be in
order of least significant bit (lsb) to most significant bit (msb). The pin values will
be combined based on this.
Example:
RA0 (lsb) RA1 (msb) Data Value 0 0 0 1 0 1 0 1 2 1 1 3 - Click OK to add the bus(es) to the Logic Analyzer window.
To add more buses, repeat the steps above. Up and down arrow icons to the right of the “Bus(es)” text box may be used to select the display order of the buses in the window. A “Delete Bus” icon is also available.
To set window properties (including color):
- Click the “Properties” tab.
- Enter the “Buffer Size” in records. Default is 10,000.
- Select “Domain Axis Units”, either “Instruction Cycles” or “Real Time”.
- Click the “Pin Color” tab.
- Select a Pin or Bus from the “Pin Selected” drop-down list.
- Specify a color to display.
- Click OK to save the Logic Analyzer Settings.
To save, load or clear settings:
- Click “Save” to save your current definitions to a file (.las).
- Click “Load” to retrieve your saved definitions from a file (.las).
- Click “Clear” to clear pin and/or bus definitions in the Settings window.
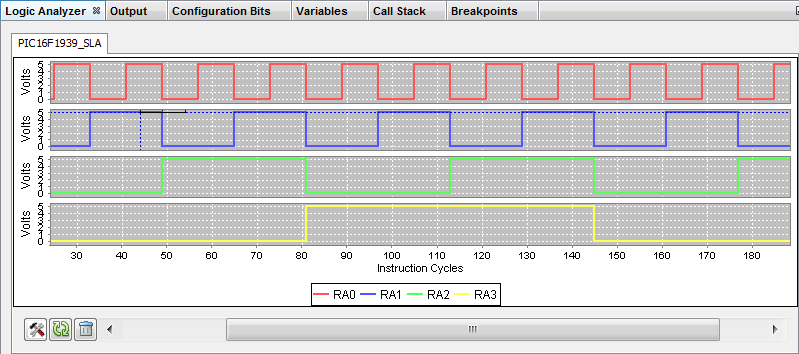
Logic Analyzer Use
Once the data sources are set up, you need to enter a debug session to view the pin and/or bus data in graphical form. Once you pause, you can examine, scroll or zoom on the displayed data.
The area of the Logic Analyzer window that contains the graph(s) is called a chart.
To view graphical data in the chart:
- Debug Run and then Pause (button, breakpoint, etc.) your program.
- View the graph(s) of pin and/or bus data.
- Debug Run and Pause again to see the data change.
To resize the graph(s) in the chart: Right click on a graph area to pop up the context menu. Select “Auto Range”. The graph(s) will size in the chart.
To zoom in or out of the graph(s) in the chart:
- Click and drag to select a range of data to zoom in on. Click Reset Zoom to zoom out to the top level.
- Right click on a graph area to pop up the context menu. Select either “Zoom In” or “Zoom Out” and specify what Axis to zoom.
To scroll the graph(s) in the chart: Use the scroll bar on the bottom of window to scroll the graph(s).
To see the location and value of a graph data point: Hover over a data point to see the point domain location and data value, i.e., (location, value).
To compare two sets of data:
- Hover over the first graph point and click to set a marker.
- Hover of the second graph point and click to set another marker.
- The (location, value) delta for each graph will be displayed in the upper right corner of that graph.
- To remove a marker, hover close to the marker to be removed, right click and select “Remove Marker”.
To set up the appearance of the chart:
- Right click on a graph area to pop up the context menu. Select “Properties”.
- In the Chart Properties dialog, enter a Title, Axes Name(s) and other formatting information as you wish.
- Click OK when done.
To save, copy or print the chart:
Right click on a graph area to pop up the context menu. Then:
- Select “Save As” to save the current graph(s) view as an image file.
- Select “Copy” to copy the current graph(s) view to the clipboard. Paste into any graphic application.
- Select “Print” to print the current graph(s) view.
Logic Analyzer Window and Dialogs
See Logic Analyzer Window and Related Dialogs for a list of window controls and all associated dialogs.