
2.2 Using Simulator Trace
Tracing allows you to record the step-by-step execution of your code and examine this recording.
The default is set for 64K records and is recorded internally in RAM to create fast access to the trace buffer. For records larger than 64K, a RAM file buffer (essentially disk space) is used and the speed is much slower. Except when there is no alternative for capturing a large buffer of data, it is recommended that records are kept to less than 64K to minimize the delay.
Simulator Trace Setup
Before you can trace, you must set up the simulator to use this feature.
To set up trace:
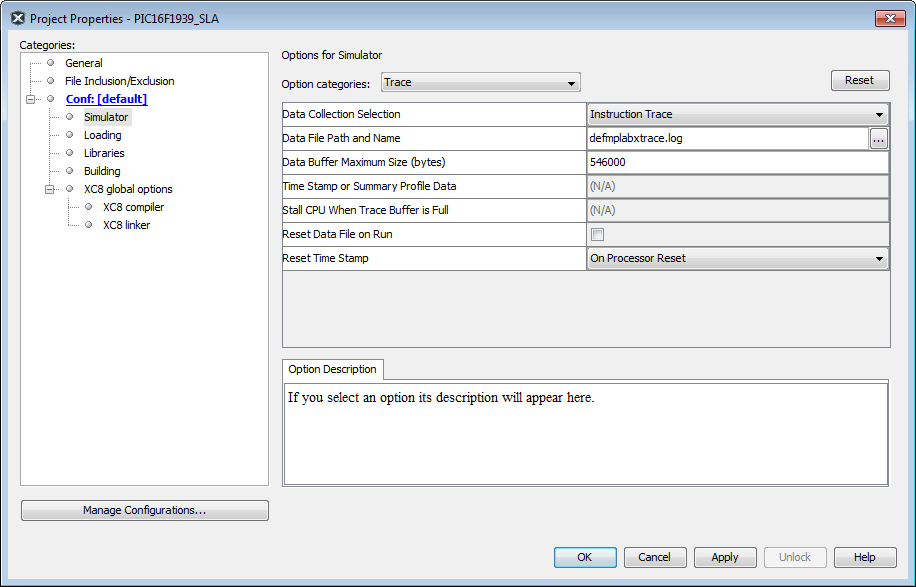
- Select File>Project Properties, “Simulator” category, “Trace” option category.
- Change “Data Collection Selection” from “Off” to “Instruction Trace”. This is the type of trace used by the simulator.
- Specify other options under trace. Click OK when complete.
For details on trace and other simulator options, see Trace Options. Also, clicking on the option text may show additional information in the “Option Description” box.
Simulator Trace Use
Open the Trace window from Window>Debugging>Trace.
Once trace is set up and the Trace window is open, you need to enter a debug session to view trace data in the Trace window. Once you pause, you can examine, scroll or save on the displayed data.
To view data in the window:
- Debug Run and then Pause (button, breakpoint, etc.) your program.
- View and/or scroll the data.
- Debug Run and Pause again to see the data change.
To move to a specific line: Select a line in the trace window and then right click to select Go To>Line, where Line is either the trigger line (at 0), top trace line, bottom trace line or a line of your choosing (Trace Line).
To view registers by name instead of address: Select a line in the trace window and then right click to select “Symbolic Mode”.
To view the Cycles column: Select a line in the trace window and then right click to select Display Time>Format, where Format is either cycle time in hexadecimal, decimal, seconds or engineering format.
To resize the columns: Mouse over column headings until a double arrow appears. Click and drag to increase or decrease the column width.
To find items in the trace display: Select a line in the trace window and then right click to select “Find”.
To view the corresponding line in the source:
- Double click on a line in the trace window to move the program counter to the corresponding line in source code.
- Select a line in the trace window and then right click to select “Go To Source Line” to move to the corresponding line in source code.
To save or print the trace display:
- Select a line in the trace window and then right click to select “Output To File”. Enter a range of lines to output to a file.
- Select a line in the trace window and then right click to select “Print”.
Trace Window and Related Dialogs
Tracing allows you to record the step-by-step execution of your code and examine this recording. For information on using this window, see Trace Options.
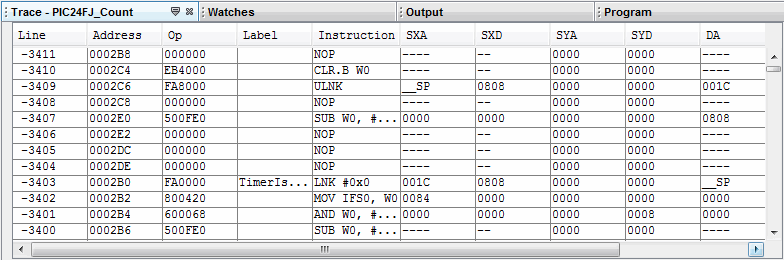
To open a Trace tab, select Window>Debugging>Trace. The Trace tab opens, see following figure.
Right clicking on a trace column in the window will pop up the context menu (first table). Dialogs associated with trace are defined in the second table.
| Menu Item | Description |
|---|---|
| Symbolic Mode | For the “Instruction” column, toggle between displaying literal register addresses (e.g., 0x5) or symbolic register macros (e.g., PORTA). |
| Verbose Labels | Show internal compiler labels. |
| Go To | Trigger: Move to the trigger line
(0). Top: Move to the top trace line. Bottom: Move to the bottom trace line. Trace Line: Specify and go to a trace line location. Opens a Go To dialog. |
| Go To Source Line | Select a trace line and then select this option to go to the corresponding line in source code. |
| Display Time | For the “Cycle” column (will display if not
previously visible): As Hex Cycle Count: Display cycle count as hexadecimal As Decimal Cycle Count: Display cycle count as decimal In Seconds Elapsed: Display cycle count in seconds elapsed In Engineering Format: Display cycle count in the appropriate engineering format (powers of 103). |
| Clear Trace File | Clear the data in the trace display. |
| Find | Find items in trace display. Opens a Find dialog. |
| Output To File | Save the trace data to a file. Opens Define Range dialog, which opens a Save dialog. |
| Print the data. Opens a Print dialog. | |
| Adjust Table Columns | Auto-adjust the columns in the trace display to fit the data. |
| Reload View | Reload the original data view for the trace display at pause. |
| Dialog | Description |
|---|---|
| Go To | Specify a trace line to go to. |
| Find | Find a line number or other data in the trace display. |
| Output to File Range | Specify a range of lines to output to a file. Click OK to proceed to the Save dialog to save the data to a text file. |
| Save | Save data to a text file. |
| Specify the printer, page setup and appearance before printing. |