2.7 Using Code Coverage
The code coverage feature provides visibility as to what portions of the code are being executed.
Code coverage differs from traced code in the following way:
- Trace displays code that has been executed and tells when it was executed.
- Code coverage notes code that has been executed, but does not display when it was executed.
This feature works by latching addresses of the opcode as it executes in a debug session. With code coverage enabled, the next pause (step, software breakpoint or Pause command) will cause a report to be written to either the Output window, Debugger Console tab, or Output file, depending on options chosen.
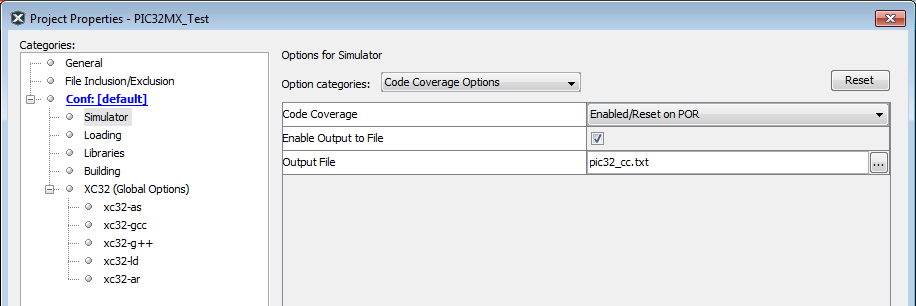
Select File>Project Properties, “Simulator” category, “Code Coverage Options” option category to see code coverage options:
- Code Coverage - Select Disable, Enable/Reset on POR, or Enable/Reset on Run.
- Enable Output to File - Check to send the output to a file. Otherwise, output appears in the Output window.
- Output File - Enter the full path to the output file, if selected.