
3.9 Debugging the User Application Using SoftConsole
(Ask a Question)Before debugging, the board and the serial terminal must be set up. For more information about the board and serial terminal setup, see Board Setup and Serial Terminal Emulation Program (PuTTY) Setup.
To debug the application, perform the following steps:
- From the Project Explorer, select the MiV_uart_blinky project, and then click the Debug icon from the SoftConsole toolbar, as shown in the following figure.
Figure 3-29. Debug Icon 
- In the Create, manage, and run configurations window, double-click GDB OpenOCD Debugging to generate the debug configuration for the MiV_uart_blinky project.
- Select the generated MiV_uart_blinky Debug configuration, and click Search Project (if by default not available), as shown in the following figure.
Figure 3-30. Create, manage, and run configurations Window – Main Tab 
- Select the MiV_uart_blinky.elf binary from the Program Selection window, and click OK, as shown in the following figure.
Figure 3-31. MiV_uart_blinky.elf Selection 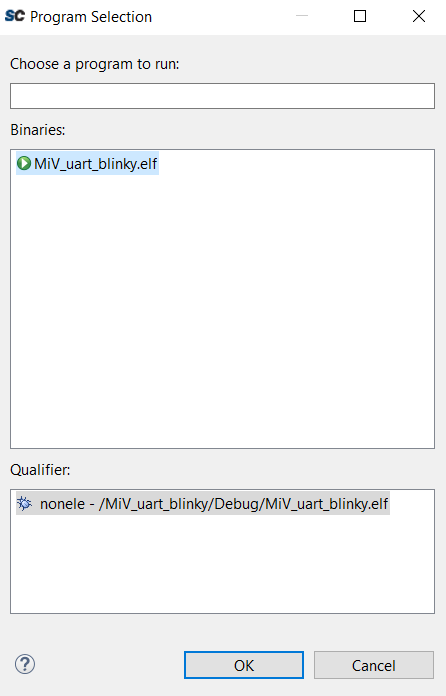
- Go to the Debugger tab, and replace the Config options, Executable name, and Commands as follows:
- Config Options: --file board/microsemi-riscv.cfg
- Executable name: ${cross_prefix}gdb${cross_suffix}
- Commands:
set mem inaccessible-by-default offset arch riscv:rv32set $target_riscv = 1set remotetimeout 7Figure 3-32. Create, manage, and run configurations Window – Debugger Tab 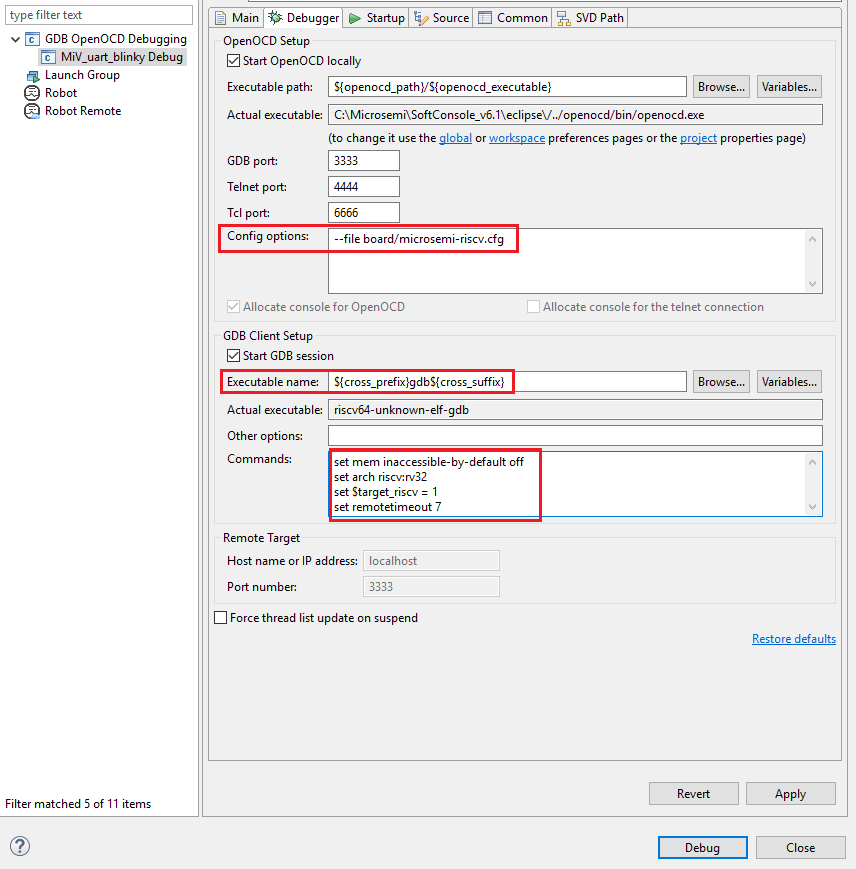
- In tab, clear the Pre-run/Restart reset check box to halt the program at the main () function, and clear the Enable ARM semihosting check box.
Figure 3-33. Debug Settings- Startup Tab 
- Click Apply, and then click Debug, as shown in the preceding figure.
The Confirm Perspective Switch dialog opens, as shown in the following figure.
Figure 3-34. Confirm Perspective Switch Dialog Box 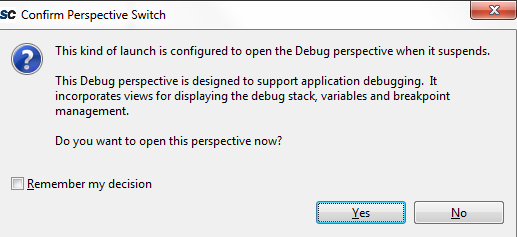
- Click Yes.
The debugger halts the execution at the first instruction in the
main.cfile, as shown in the following figure.Figure 3-35. First Instruction in the main.c File 
- On the SoftConsole toolbar, click the Resume icon to resume the application execution, as shown in the following figure.
Figure 3-36. Resume Application Execution 
- The string Hello World! is printed on the serial terminal, as shown in the following figure. Also, LEDs 4, 5, 6, and 7 on the PolarFire Evaluation Board blink.
Figure 3-37. Hello World in Debug Mode 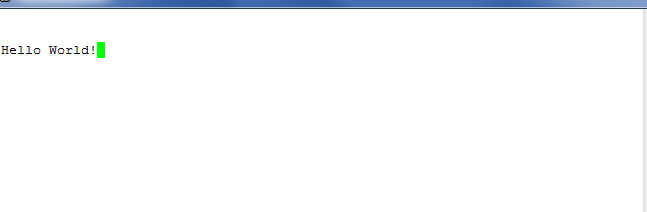
- On the SoftConsole menu, click to suspend the execution of the application.
- Click the Registers tab to view the values of the Mi-V internal registers, as shown in the following figure.
Figure 3-38. Mi-V Register Values 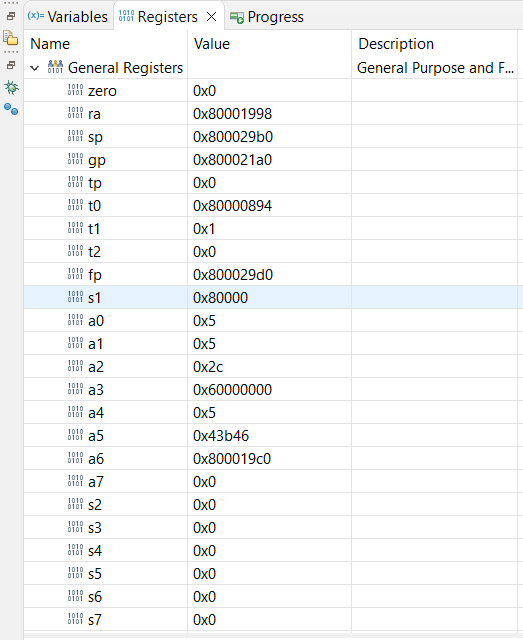
- Click the Variables tab to view the values of variables in the source code, as shown in the following figure.
Figure 3-39. Variable Values 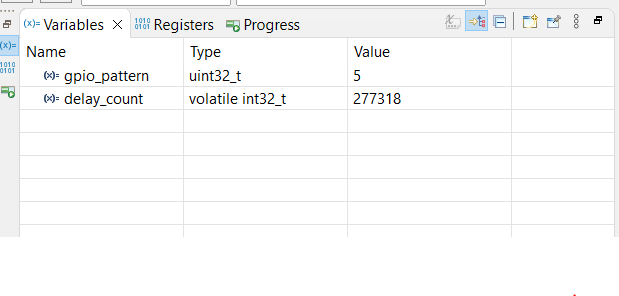
- From the SoftConsole toolbar, use the Step Over option to view the application execution line by line, or use the Step Into option to execute the instructions inside a function. Use the Step Return option to come out the function. You can also add breakpoints in the application source code.
- On the SoftConsole toolbar, click Terminate to terminate the debugging of the application.
- Close PuTTY and SoftConsole.