
15.3.1 Getting Started with SmartDebug
(Ask a Question)- Create your design.
- Expand Debug Design and double click SmartDebug Design in the Design Flow window. SmartDebug opens for your target device.
- Click View Device Status to view the device status report and check for issues.
15.3.1.1 Use Models
(Ask a Question)SmartDebug can be run in the following modes:
15.3.1.1.1 Integrated Mode
(Ask a Question)Running SmartDebug in Integrated mode allows you to access all design and programming hardware information. No additional setup is required. In addition, the Probe Insertion feature is available in Debug FPGA Array.
To run SmartDebug in Integrated mode, expand Debug Design in the Libero Design Flow window, and then double click SmartDebug Design. Unlike Standalone mode, you do not have to create a project to use SmartDebug in Integrated mode.
15.3.1.1.2 Standalone Mode
(Ask a Question)SmartDebug can be installed separately in the setup containing FlashPro Express and Job Manager. This provides a lean installation that includes all the programming and debug tools to be installed in a lab environment for debug. In this mode, SmartDebug is launched outside of the Libero Design Flow. When launched in Standalone mode, you must create a project and import a Design Debug Data Container (DDC) file exported from Libero to access all debug features in the supported devices.
In the main use model for standalone SmartDebug, the DDC file must be generated from Libero and imported into a SmartDebug project to obtain full access to the device debug features. Alternatively, SmartDebug can be used without a DDC file with a limited feature set.
Creating a Standalone SmartDebug Project
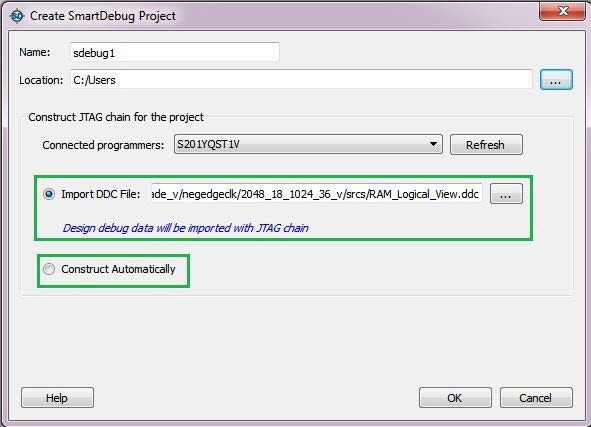
(Ask a Question)Creating standalone SmartDebug projects starts with the Create SmartDebug Project dialog box. This dialog box provides two options for creating standalone SmartDebug projects:
- Import DDC File creates a standalone object from DDC files created in Libero.
- Construct Automatically creates a debug project with all the devices connected in the chain for the selected programmer.
To display the Create SmartDebug Project dialog box, from the SmartDebug main window, click Project and choose New Project.
Import DDC File Created from Libero
(Ask a Question)- The Design Debug Data of the target device and all hardware and JTAG chain information in the DDC file exported in Libero.
- The programming file information loaded onto other Microchip devices in the chain.
Debug data is imported from the DDC file (created through Export SmartDebug Data in Libero) into the debug project, and the devices are configured using data from the DDC file.
If the DDC version and software version are not compatible, you cannot create the project. In this case, PolarFire users must run Generate SmartDebug FPGA Array Data under Debug Design in Design Flow. All users must then click Export SmartDebug Data under Handle Design for Debugging in Design Flow to export a new DDC file for use with project creation.
Construct Automatically
(Ask a Question)Selecting the Construct Automatically option in the Create SmartDebug Project dialog box creates a debug project with all the devices connected in the chain for the selected programmer. This is equivalent to Construct Chain Automatically in FlashPro.
Connected Programmers Drop-Down List
(Ask a Question)The Connected Programmers drop-down list in the Create SmartDebug Project dialog box shows all FlashPro programmers connected to the device. Select the programmer connected to the chain with the debug device. At least one programmer must be connected to create a standalone SmartDebug project.
Before a debugging session or after a design change, program the device using Programming Connectivity and Interface in Design Flow.
15.3.1.1.3 Demo Mode
(Ask a Question)- Active Probe
- Live Probe
- Memory Blocks
- Transceiver
- Debug sNVM
- Debug UPROM
- Debug DDR
- Debug IOD
To run SmartDebug in Demo mode, start SmartDebug in either Integrated or Standalone mode when the hardware is not connected.
15.3.1.2 Configuring a Generic Device
(Ask a Question)For Microchip devices that have the same JTAG IDCODE (that is, multiple derivatives of the same Die), configure the device type for SmartDebug to enable relevant features for debug. To configure the device, load the programming file by selecting the device using Configure Device in Design Flow, or import DDC files using Programming Connectivity and Interface in Design Flow. When the device is configured, all debug options are shown.
For debug projects created using Construct Automatically, use the following options to debug the devices:
- Load the programming file: Right click the device in the Programming Connectivity and Interface view.
- Import Debug Data from DDC file: Right click the device in Programming Connectivity and Interface view.
The appropriate debug features of the targeted devices are enabled after the programming file or DDC file is imported.
15.3.1.3 Debugging Devices Connected in a JTAG Chain
(Ask a Question)- In Libero, under Handoff Design for Debugging, click Export SmartDebug Data.
- When the Export SmartDebug Data
dialog box appears, select the parameters shown in the following figure.
Figure 15-50. Export SmartDebug Data Dialog Box 
- Start SmartDebug in stand-alone
mode, and then click Construct Automatically in the
Create SmartDebug Project dialog box to create a debug project with all the
devices connected in the chain for the selected programmer.
Figure 15-51. Create SmartDebug Project Dialog Box 
- In Design Flow, open
Programming Connectivity and Interface, enable the
devices for programming, and load the DDC file exported in step 2. After the DDC
file loads successfully for all the devices, program the devices.
Figure 15-52. Enable Device for Programming 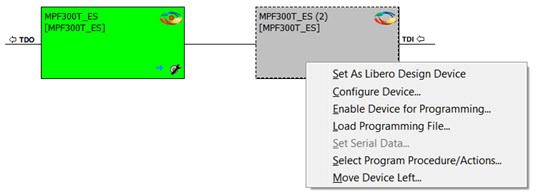
- When you finish programming, close the Programming Connectivity and Interface. The Device drop-down list in SmartDebug shows the devices connected in a JTAG chain.
- Use the
Device drop-down list to select the device you want
to debug.Important: You can debug only one device at a time.
