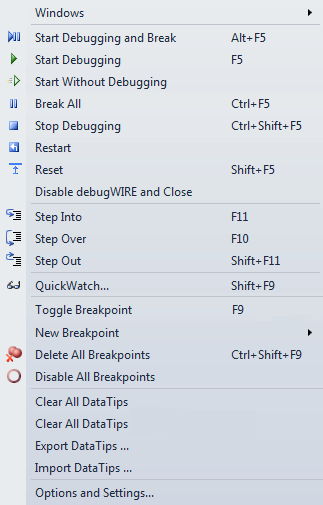
4.6 Debug Control
Several commands are available for controlling the debugger. They are available from both the Debug menu and several toolbars. The Microchip Studio Integrated Development Environment (IDE) has two major operating modes; design mode and debug mode. Design mode is when editing the source code project, while the debug mode is when you debug your project. The IDE adapts to modes, menus, and toolbar changes.
- In design mode, the available debug commands are those that will start the debug session, e.g., Start Debugging and Break, Start Debugging, Start without Debugging
- In debug mode, you will find commands like Break All, Step Out, and Reset

- Start Debugging and Break
-
Starts the debugger and breaks the execution on the first statement of the program.
- Start Debugging
-
Starts the debugger and runs the program. In debug mode and stopped, it resumes execution.
- Start Without Debugging
-
Programs the project without starting debugging. For details, see Start Without Debugging.
- Break All
-
Halts the debugger.
- Stop Debugging
-
Stops and terminates the debug session and returns to design mode.
- Restart
-
Restarts the debugger and reloads the program.
- Reset
-
Resets the program to the first statement.
- Disable debugWire and Close
-
Available when debugging a device using the debugWire interface. The command disables the debugWire interface (enabling the ISP interface) and terminates the debug session.
- Step Into
-
Executes one instruction. When in disassembly-level, one assembly level instruction is executed. Otherwise, one source-level instruction is executed.
- Step Over
-
Similar to Step Into, Step Over executes one instruction. However, if the instruction contains a function call/subroutine call, the function/subroutine is executed. If encountering a user breakpoint during Step Over, execution is halted.
- Step Out
-
Continue execution until completion of the current function. If encountering a user breakpoint Step Over, execution is halted. If a Step Out command is issued when the program is on the top level, the program will continue executing until it reaches a breakpoint or is stopped by the user.
- Quick Watch
-
Adds a Quick Watch for the variable or expression under the cursor. For details, see QuickWatch and Watches.
- Toggle Breakpoint
-
Toggle the breakpoint status for the instruction where the cursor is placed. Note that this function is available only when the source window or disassembly window is the active view.
- New Breakpoint
-
Create a new breakpoint at the location of the cursor. For more information, see Breakpoints.
- Disable All Breakpoints
-
This function clears all set program breakpoints, including breakpoints that have been disabled.
- Clear All DataTips
-
Clear all marked Data Tips. For more information, see DataTips.
- Export Data Tips
-
Save all marked Data Tips to a file in Visual Studio Shell format.
- Import DataTips
-
Load Data Tips from a Visual Studio Shell file.
- Options and Settings
-
Debug options and settings. See Debugger.
