4.13 Processor View

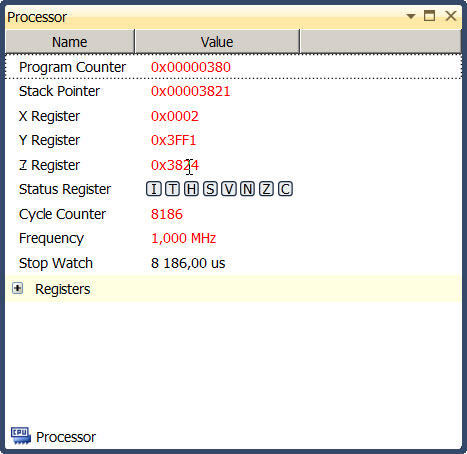
Debug → Processor View. The processor view offers a simulated or direct view of the current target device MPU or MCU. You can see a partial list of the simulated device's ATxmega128U1 registers in the picture above.
The program counter shows the address of the instruction being executed. The stack pointer shows the application's current stack pointer value. The X, Y, and Z registers are temporary pointers that can be used in indirect passing or retrieving arguments or objects to and from functions. The Cycle counter counts the cycles elapsed from the simulation’s start. Status register or SREG shows the currently set flags. Further on, you will be able to toggle a setting for displaying the flag names.
The stopwatch field allows you to make rudimentary profiling of your application. It influences by the frequency set in the Frequency field, which defines the target MCU/MPU frequency whenever the prototyping board is connected.
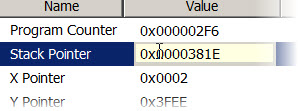
Each register can be displayed in hexadecimal, decimal, octal, and binary (flag) format by right clicking and choosing Display in binary, etc., or Display in.... Each field can also be modified, as shown in the below image. If a field is a status or flags register composed of a number of the one-bit flags, you can toggle individual flags by clicking on them -  .
.

The processor view is only active in the debug mode.
