4.16 Call Stack Window
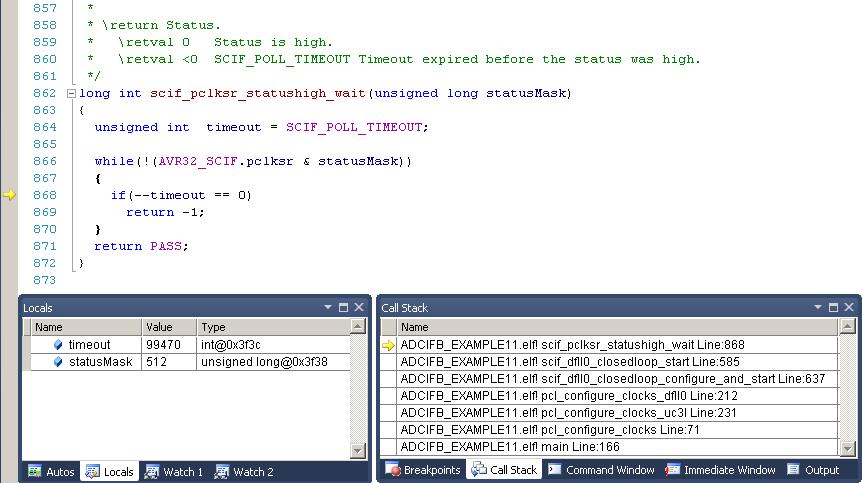
Call Stack shows the hierarchical information of callers of the current method. By default, the Call Stack window displays the name of each function. To display Call Stack, Click the menu, Debug → Windows → Call Stack.

Along with function name, optional information such as module name, line number, etc., may also be displayed. The display of this optional information can be turned ON or OFF. To switch ON/OFF the optional information displayed, right click the Call Stack window and select or deselect Show <the information that you want>.

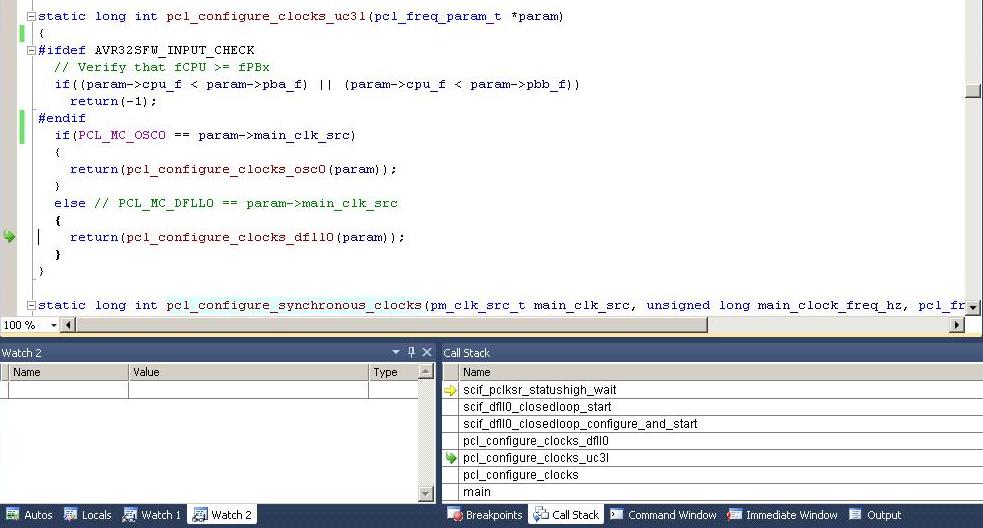
A yellow arrow indicates the stack frame of the current execution pointer. By default, this is the frame whose information appears in the source, Disassembly, Locals, Watch, and Auto windows. The stack frame context is changeable to be another frame displayed in the Call Stack window.
To Switch to Another Stack Frame
- In the Call Stack window, right click the frame whose code and data you want to view.
- Select Switch to Frame.
A green arrow with a curly tail indicates the changed stack context. The execution pointer remains in the original frame, which is still marked with the yellow arrow. The execution will be continued from the yellow arrow, not the selected frame, when selecting Step or Continue from the Debug menu.

To View the Source/Disassembly Code for a Function on the Call Stack
- In the Call Stack window, right click the function whose source code you want to see and select Go To Source Code.
- In the Call Stack window, right click the function whose disassembly code you want to see and select Go To Disassembly.
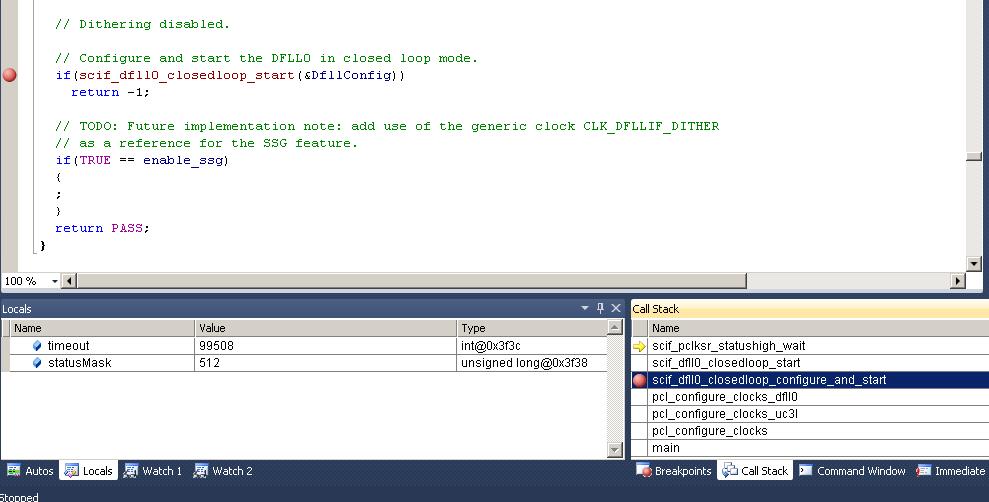
To Set a Breakpoint at the Exit Point of a Function Call
In the Call Stack window, right click the stack frame you would like to add the breakpoint. Select 'BreakPoint → Insert Breakpoint' to add the breakpoint.

