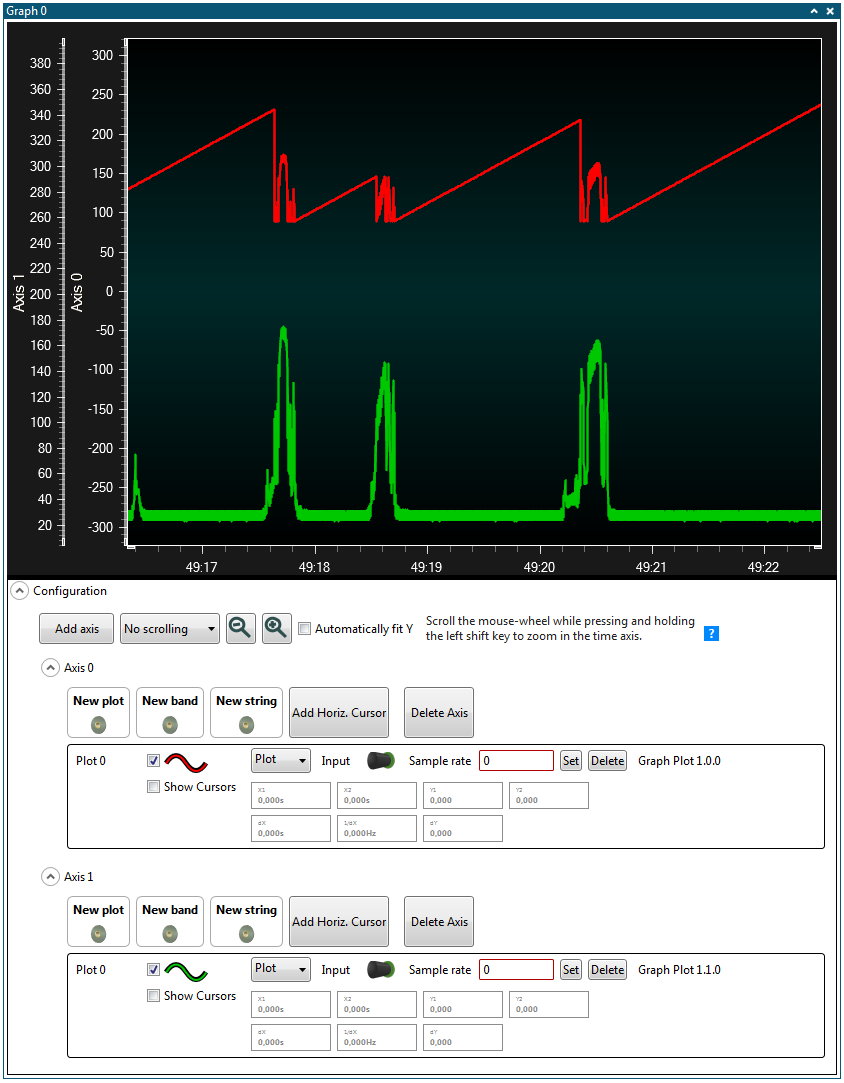
3.2.1.1 Graph Configuration Panel
Through its Configuration panel, the Graph module is connected to the rest of the system. Here you can add more axes, plots, and other graph elements. Here you will also connect the graph elements by connecting sources and sinks.
- Add axis button.
- Auto-scroll checkbox.
- Automatically fit Y checkbox.
Add Axes

Press the Add axis button to add an Y axis to the graph. It will show up in the plot area, and its controls will be added to the bottom of the Configuration panel.
Delete Axes
-
If the configuration section for the axis you want to delete is hidden, first expand it by clicking the arrow icon.
-
Delete the axis by pressing its Delete Axis button.
Enabling and Disabling Auto-scrolling
Auto-scrolling locks the plot area to include the latest arriving samples. If auto-scrolling is disabled, manually scroll the plot by dragging the time axis with the mouse or with the scroll wheel.
Auto-scrolling is enabled by selecting the Auto-scroll check box.
Auto-sizing the Y Axis
When the Automatically Fit Y check box is checked, the Y axis will automatically zoom in or out in order to fit the whole sample range of the plots in that axis.
