
4.5.1.2 DC Signal With Random Noise
- ADC2 computation mode: Basic
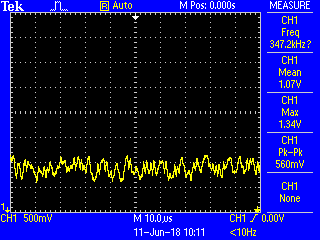
- Input signal: DC ~1V + Random noise 0.5V peak-to-peak
- Verify that LEDs D2, D3, D4, and D5 are illuminated
- Configure the Signal & Noise Generator board to generate a DC signal of ~1V and random noise with 0.5V peak-to-peak
- Verify the input signal using an oscilloscope. The expected result is as shown below.
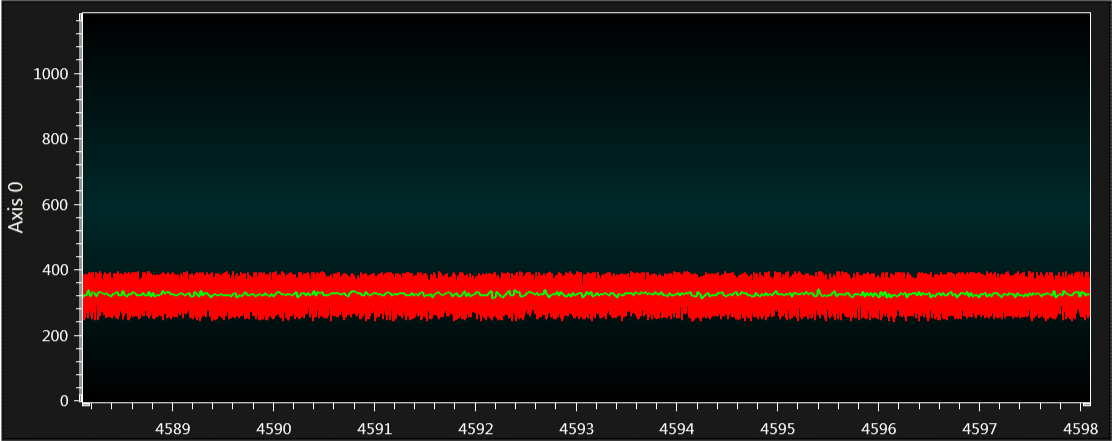
The Data Visualizer graph is as shown in Figure 4-4. A red colored signal is noisy input signal (ADRES value), a green colored signal is the filtered signal attained using software averaging in code with 32 samples.
From the graph, it can be seen that the noise has been suppressed using a simple averaging technique. In the example source code, the averaging has been done with 32 samples.
If the signal is zoomed, the image is as shown in Figure 4-5.
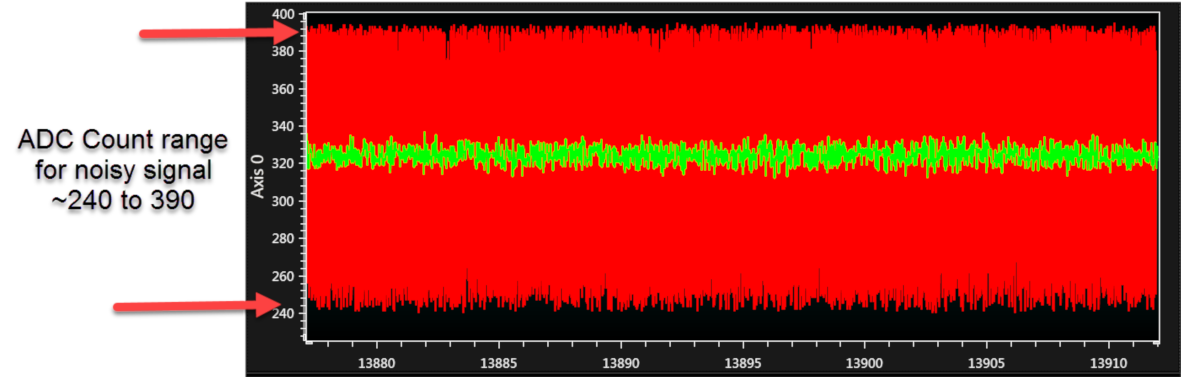
From the graph, the ADC count for a noisy signal can be seen varying from ~ 240 to 390 because of random noise. That means the ADC count is varying ±75 counts (390 to 240 → 315 ± 75 counts).
If the signal is zoomed further, the image is as shown in Figure 4-6.
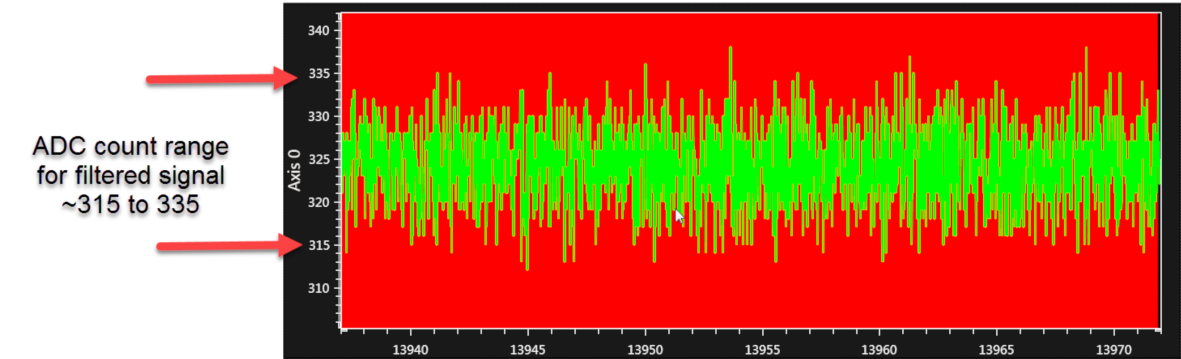
ADC count for a filtered signal can be seen varying from ~ 315 to 335. That means the ADC count is varying ±10 counts (335 to 315 → 325 ± 10 counts).
Cons: The software overhead of accumulating and averaging needs to be handled in the code.