4.5.1.1 DC Signal With No Noise
Task: The graph is plotted in Data Visualizer using a DC signal
without noise.
- ADC2 computation mode: Basic
- Input signal: DC ~1V with no artificial noise added
Test Setup:
- Configure VDD on the HPC board to 3.3V
- Configure the Signal & Noise Generator board to generate a DC signal of ~1V
- Verify the input signal using an oscilloscope
- Verify that LEDs D2, D3, D4, and D5 are illuminated
The input signal is connected to the ADC input pin RA1 and a graph in Data Visualizer is plotted as illustrated in Figure 4-1. A red colored signal is the ADC input signal (ADRES values), a green colored signal is a filtered signal using a simple averaging technique.
Note: Though any artificial noise hasn't
been added to the input signal, some system noise is present and showed in the graph
as the ADC count value of the input signal is varying from 321 to 327. The result
may vary from one setup to another.
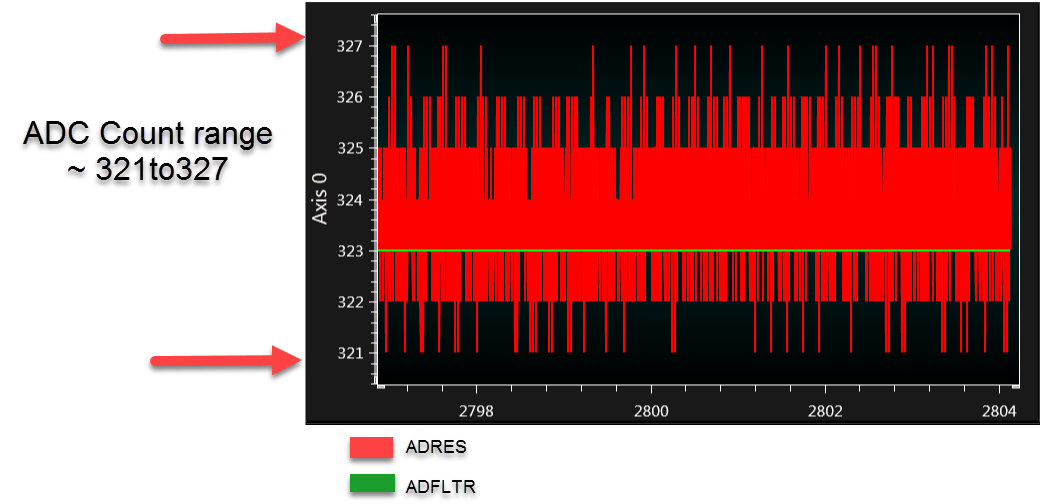
From the graph, the ADC filtered signal shows ADC count 323. In Basic mode, the filtered result is attained using software averaging in code with 32 samples.
Note: Test setup measures DC 1.06V here. The
ADC reference voltage is VDD=3.3V and the ADC resolution is 10-bit. Ideally
measured ADC count should be (1023 x 1.06)/3.3 = 328.
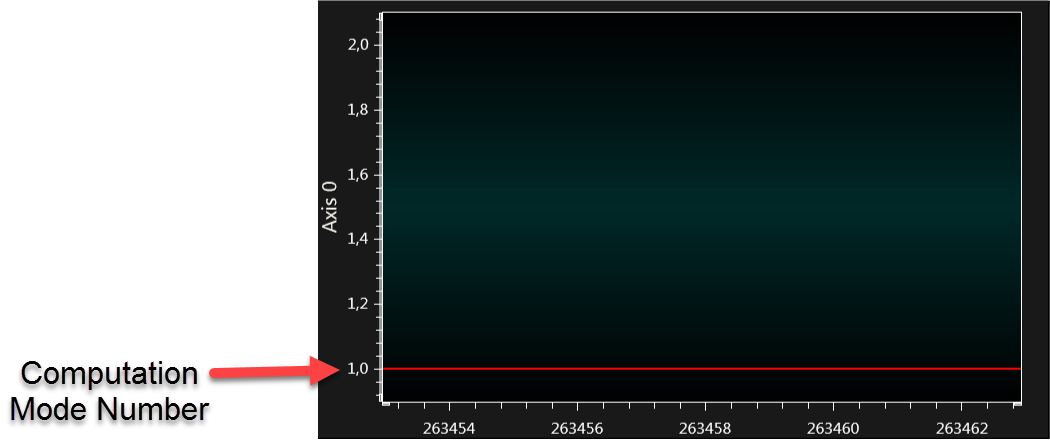
ADC2 computation mode number is 1 for the Basic mode as shown in the Data Visualizer graph illustrated in Figure 4-2.