
4.1.1 Select a Visualization Method First
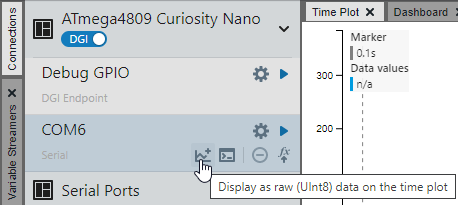
Hover over a source to see available visualization options, such as plot raw data  , display
text in the terminal
, display
text in the terminal  , or create a variable streamer
  . Once
selected, the data will begin streaming using the option selected. You can select one or
more visualizations.
. Once
selected, the data will begin streaming using the option selected. You can select one or
more visualizations.
The source can also be dragged and dropped onto the Time Plot as described in Connections and Protocols, on the Terminal as described in Connections Tab or on the Dashboard as described in Placing Widgets on the Dashboard and Sending Values to and from Widgets.