
4.19.2.1 Trace Stack View
Trace Stack View is populated with program trace information while the target is in a running or debugging state.
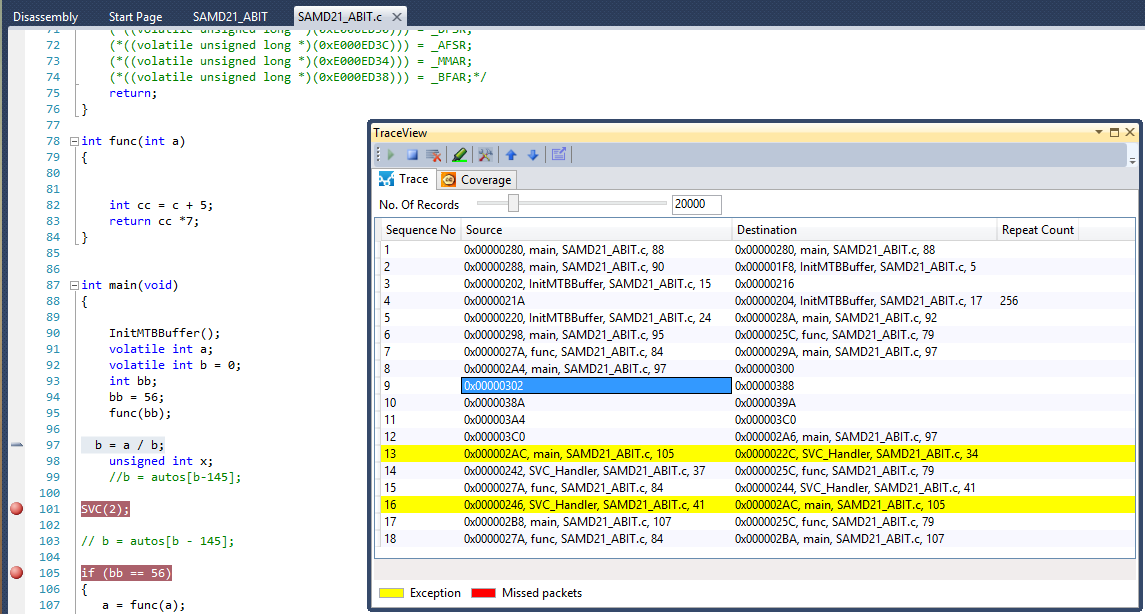
Trace Stack View contains a sequence number, source and destination address, and a repeat count. A new program trace record is shown when a branching instruction happens on the target, for example, as a function call or a return from a function.
- Sequence Number - A number that keeps track of the order of the record. This number is reset for every trace session. This number will be continued without a break when the trace is cleared using the clear button from the toolbar.
- Source - Represents the instruction/source line from which the branch happened. For example, in a function call,”Source” is the source line from where the function is called.
- Destination - Represents the instruction/source line to which the branching happened. For example, in a function call, “Destination” is the source code of the starting line of the function.
- Repeat Count - Represents the number of times the same source and destination combination occurred consecutively.
The source and destination contain the instruction address, function name, source filename, and line number. If the source line cannot be mapped, only the instruction address is given. Double clicking on the source or destination navigates the cursor in the editor to the appropriate line. Use the navigation keys Up, Down, Left, Right, and Tab to locate the source/disassembly view for the trace records.
The program trace shown in the TraceStack view is, by default, reduced to the latest 20,000 records. The threshold value can be changed using the slider.
The program trace records are highlighted with a yellow color when the branching instruction was not as expected. Unexpected branches usually happen due to some exception, and the entry and exit of the exception handler are highlighted with yellow color. The branching inside the exception is not highlighted.
The next and previous exception records can be easily navigated by using the up and down arrow buttons in the trace view window toolbar.
There are some exceptional cases where missing some program traces. If so, there will be a packet with red color, representing that there is some discontinuation of the program trace information in the sequence. Since the number of missed packets is unknown, the sequence number shown in the Trace Stack view will continue without any break except for adding a red-colored packet with a sequence number.