
4.5.5.3.3 LPF Mode: AC Signal With Random Noise
Task: The graph will be plotted in Data Visualizer using an AC
signal with random noise and the effect of LPF in noise suppression is observed
- ADC2 computation mode: LPF mode
- Input signal: AC 1V peak-to-peak, frequency 1 Hz, and offset at 1.25V
Test setup:
- Verify the Computation mode number in the Data Visualizer graph is shown as 5 and that LED5 is illuminated
- Configure Signal & Noise Generator to generate an AC signal of amplitude ~1V, frequency 1 Hz, and offset at 1.25V
- Enable the random noise with 0.5V peak-to-peak
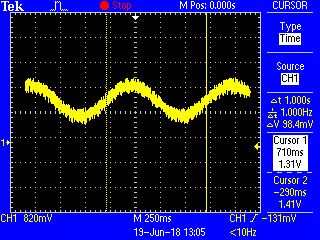
- Verify the input signal using an oscilloscope. The expected result is as shown in Figure 4-24.
The Data Visualizer graph is as shown in Figure 4-25. The red colored signal is the noisy AC input signal (ADRES value), the green colored signal is the filtered signal (ADFLTR value).
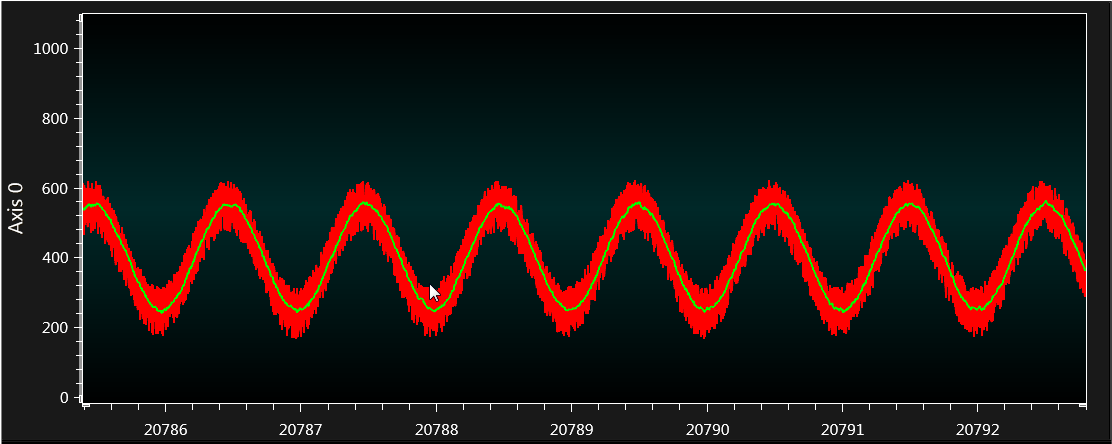
The 1 Hz signal is below the 8 Hz roll-off frequency with configured ADCRS value 5 (refer to Table 4-6). From the graph in Figure 4-25, it can be seen that when random noise is added to the 1 Hz signal, the noise suppression is achieved using the LPF mode and a relatively clean signal is observed.
Pros: The LPF removes unwanted high frequency signals from an AC input signal.