
4.5.5.3.2 Graph Illustration
Sine Signal, 1 Hz:
In the example source code, ADCRS is configured to 5. Referring to Table 4-6, the -3 dB roll-off point is 8 Hz with ADCRS = 5.
The ADC input signal has a 1 Hz frequency which is below the -3 dB roll-off point at 8 Hz. As 1 Hz is safely within the low pass-band of the filter, filtered signal and original signal are equal. It is illustrated in the Figure 4-19 graph, the red colored signal is the ADC input signal (ADRES values), the green colored signal is the filtered signal (ADFLTR values).
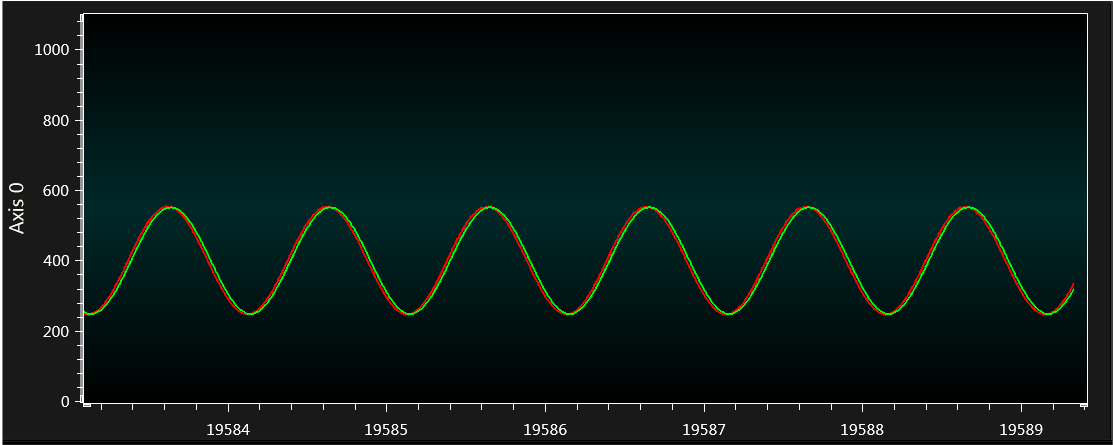
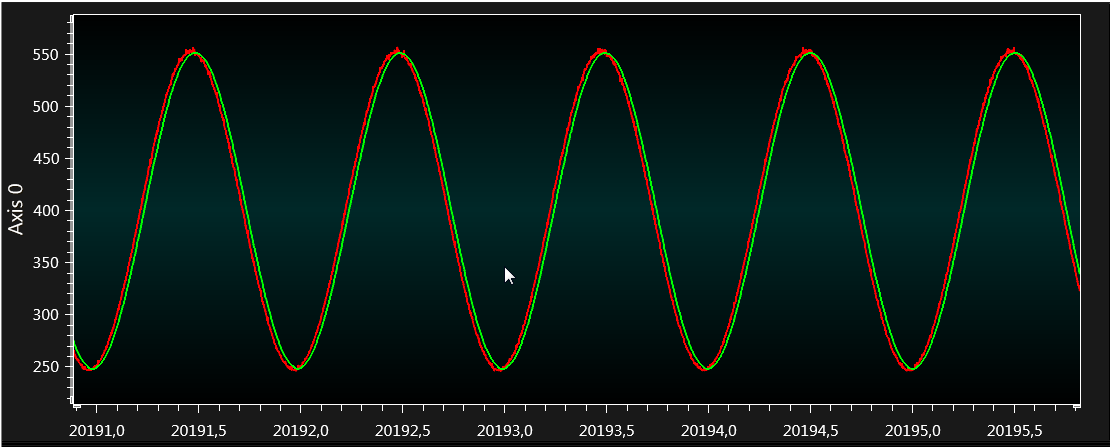
If the signal is zoomed in by selecting 'Automatically fit Y' checkbox available below graph, it can be seen that the ADC count is varying from 560 to 250. So the difference between ADC counts is 310, which is the ADC count value for configured input signal 1V peak-to-peak (310 x 3.3 /1023 =1).
Sine Signal, 8 Hz:
Now, configure the Signal & Noise Generator to generate an 8 Hz signal and adjust the scale on the graph and observe the graph.
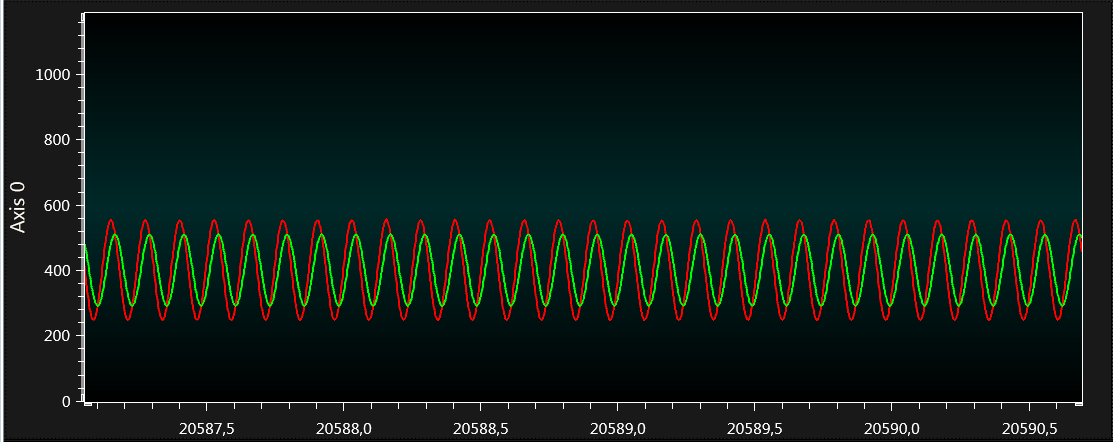
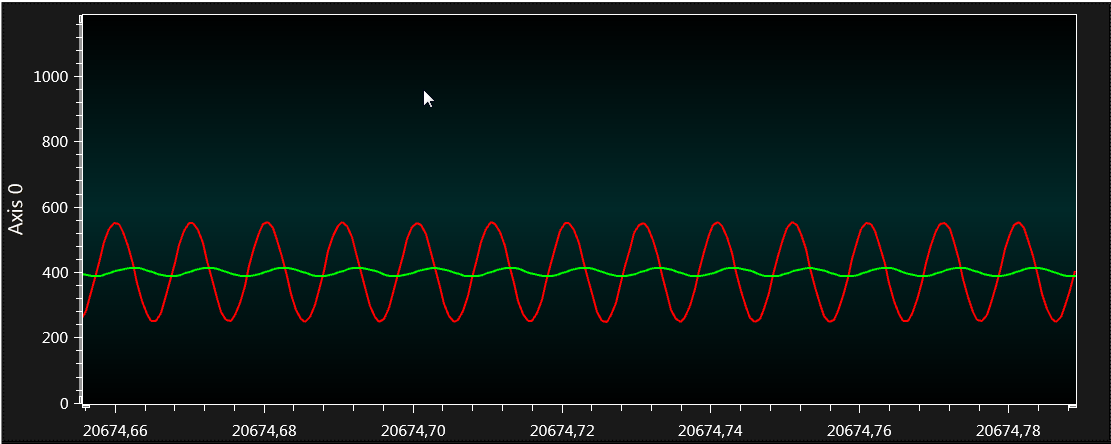
When the sine-wave’s frequency is increased and reaches 8 Hz, a reduction in peak-to-peak voltage takes place as the filter actively reduces the magnitude of the signal, as observed in Figure 4-21.
At the -3 dB frequency, the peak-to-peak amplitude should be roughly 70.7% of the original input signal.
If the signal is zoomed in the image is as shown in Figure 4-22.
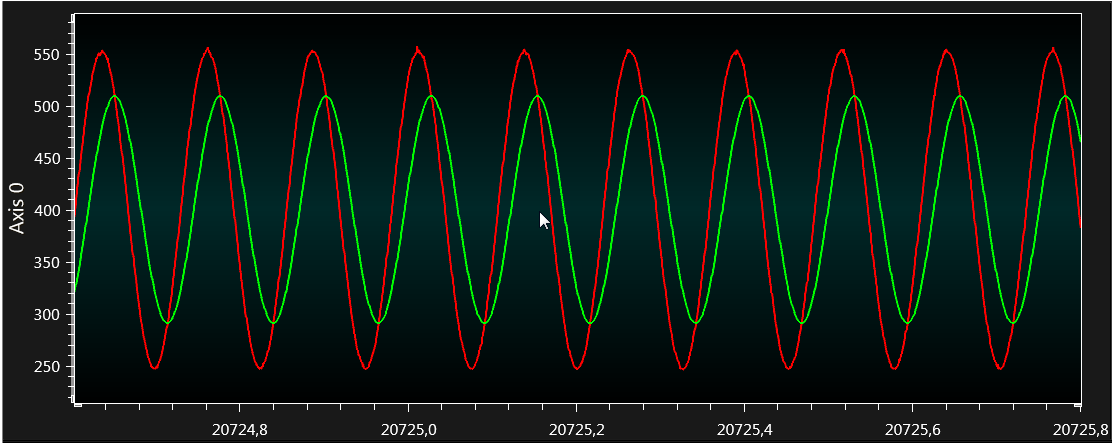
From the graph, the ADC count for the filtered signal (green colored signal) is ~ 290 to 510 (difference in ADC count values is 220) which gives the peak-to-peak voltage at 8 Hz, 0.709 V (220 x 3.3 /1023 =0.709).
If the original 1V peak-to-peak is multiplied by 0.707, a peak-to-peak voltage is 0.707V.
From the graph, the filtered signal shows that it is 70.7% of the original input signal.
If the frequency is further increased, further attenuation in an input signal is seen.
Sine Signal, 100 Hz:
Configure the Signal & Noise Generator to generate a 100 Hz signal and adjust the scale on the graph and observe the graph.
As the frequency continues to increase, the peak-to-peak range will shrink, as observed in Figure 4-23.