
4.5.3.2 AC Signal With Random Noise
- ADC2 computation mode: Average mode
- Input signal: AC 1V peak-to-peak, frequency 50 Hz and offset at 1.25V + random noise 0.5V peak-to-peak
- Verify the computation mode number in the Data Visualizer graph is 3
- Verify that LED D3 is illuminated
- Configure Signal & Noise Generator to generate an AC signal of amplitude ~1V, frequency 50 Hz, and offset at 1.25V
- Enable random noise with 0.5V peak-to-peak
- Verify the input signal using an
oscilloscope. The expected result is as shown in Figure 4-11.
Figure 4-11. AC Signal With Random Noise Oscilloscope Capture 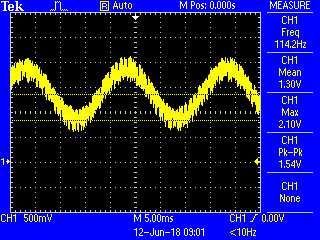
The Data Visualizer graph is as shown in Figure 4-12. The red colored signal is an AC input signal (ADRES value), the green colored signal is a filtered signal (ADFLTR value).
From the graph, it can be seen that the average result of a noisy AC signal is approaching to the offset value.
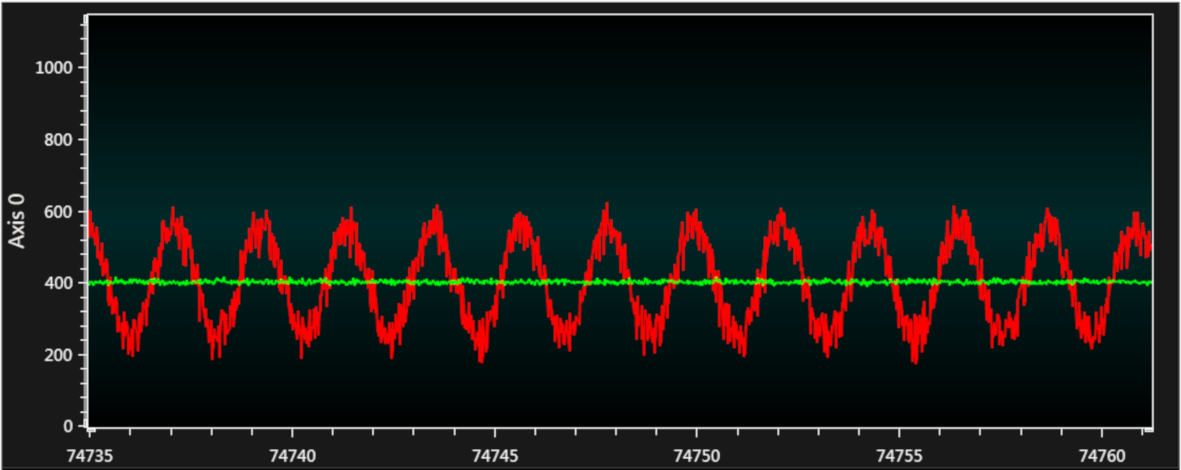
It can be seen that the average value of the noisy sine signal (the green colored signal) is ~390 to 410.
- Click the graph and press and hold the Ctrl key, and scroll the mouse wheel
The average value of an AC signal without noise is ~400 from Figure 4-10. By comparing figures Figure 4-12 and Figure 4-10, it can be seen that an average value of a noisy AC signal is close to the average value of an AC signal without noise and using the ADC2 Average mode makes it easier to calculate the average value of a noisy AC signal.