4.5.3.3 DC Signal With Random Noise
Task: The graph plotted in Data Visualizer is using a DC signal
with random noise and noise suppression is observed.
- ADC2 computation mode: Average mode
- Input signal: DC ~1V + random noise 0.5V peak-to-peak
Test setup:
- Verify the computation mode number in the Data Visualizer graph is 3
- Verify that LED D3 is illuminated
- Configure the Signal & Noise Generator board to generate a DC signal of ~1V and random noise with 0.5V peak-to-peak
- Verify the input signal using an oscilloscope
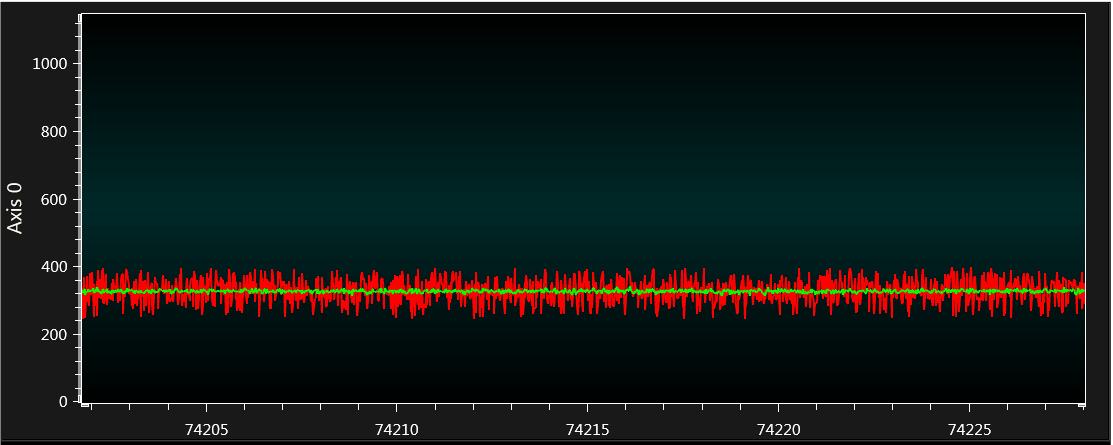
The Data Visualizer graph is as shown in Figure 4-13. The red colored signal is a noisy input signal (ADRES value), the green colored signal is a filtered signal (ADFLTR value).
From the graph, it can be seen that the noise has been suppressed using the ADC2 Average mode. In the example source code the ADCRS bits are configured to 5 resulting the averaging with 32 samples. This graph looks similar to the Basic mode (Figure 4-4) and Accumulate mode (Figure 4-7) graphs. The advantage here is that the sample accumulation and averaging handling are not needed in code as the ADACC and ADFLTR registers are available.