4.3.1.3 Add Data Axes
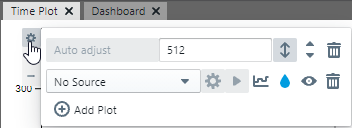
To add another data axis, hover over the top of the
graph and select the icon to add an axis  .
.
Set up axis properties on the Visualization Controls (right) pane or hover over the axis and click on “Axis Options.” On Visualization Controls is another selection to add a data axis. Both methods provide a control to add a plot to the axis.
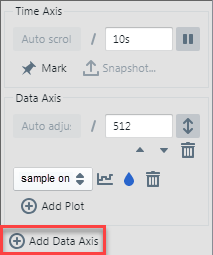
In addition, once the axis is set up, data can be plotted from the Data Sources pane by clicking the “plot” button on the selected data source.