4.3.1.1 Plot Scrolling
If plot scrolling is not active, data might not be visible even though streaming is enabled. Hover over the top of the graph and click on “Show Live Data” to start plot scrolling. Once selected, the text changes to “Pause Scrolling” to stop plot scrolling.
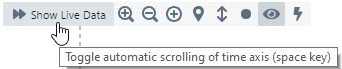
Alternately, double click or hit the Space bar to stop the data scroll (although data streaming continues in the background). Double click or hit Space again to resume the timeline.
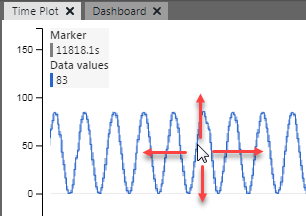
To manually move a plot, click on it and drag. Click on the left side of the plot to drag and pause the data axis. Click on the plot or in the center of the pane to drag and pause the time axis.