
4.4 Setting Up Table View
After setting up a page, it is possible to select and add signal channels to a table view. Right click the empty space of the page and select Add table row. After adding some channels to display in the table, it should look similar to Figure 4-9:
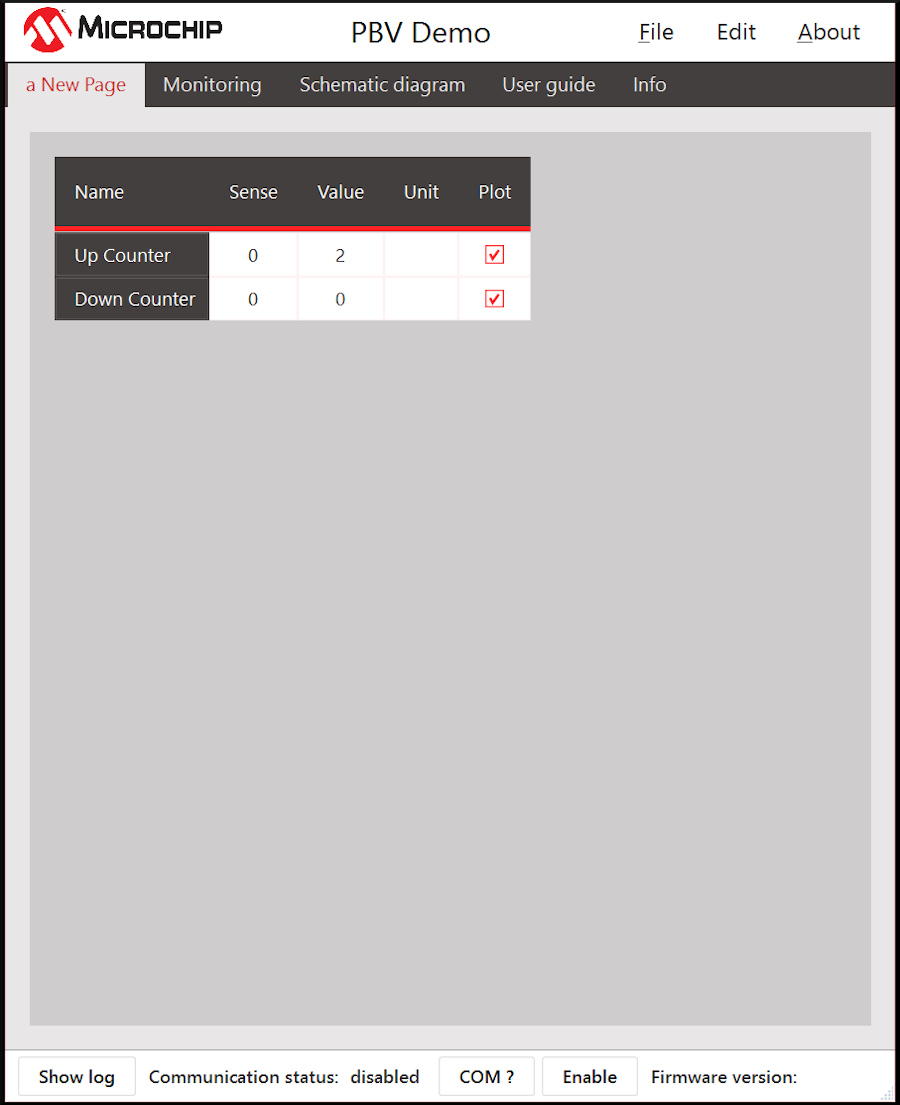
Each signal channel can only be added once to any one table. Clicking on plot would result in those values being added to plots on the Monitoring tab. Sense is the raw value that is read, and Value is the processed value based on the offset and scaling parameters defined as per signal definition, as can be seen in Figure 4-4.