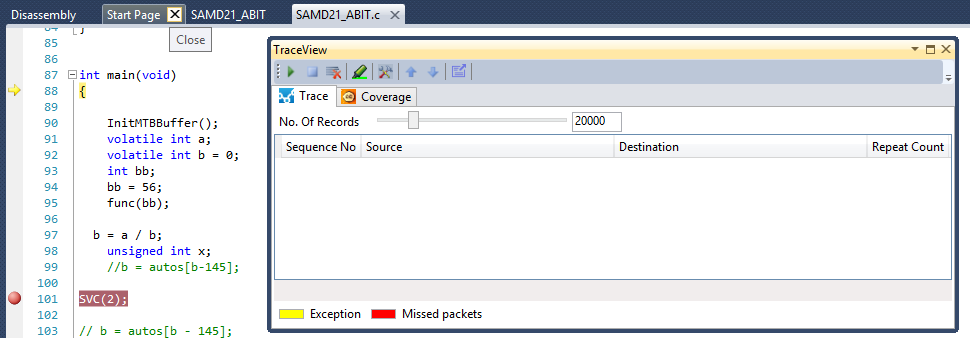
4.19.1.1 Starting the Program Trace
Start the Program Trace by clicking the play button in the Trace View Window. The start button is enabled during debugging. Trace can be started and stopped any number of times in a debug session. Starting a new trace session clears all trace information of the previous trace session.
Note: Allocate a region of SRAM to let the device
record the trace. Refer to Trace View Settings for more
information.

