
1.1.5 Collecting Sensor Data
To collect sensor data and create a new project after the device set up, follow the steps below. The goal is to collect four files for each event in the Slide Demo events (Horizontal, Stationary, Vertical), with each file lasting for 60 seconds. By the end, the project will have a total of 12 files.
The events variation must be taken in consideration when collecting the files. You are essentially training your project to detect specific events, so it is crucial to gather sufficient variation in these events to build a robust model.
For the Stationary events, consider tapping on the table near your sensor. This prevents small vibrations from being misclassified as a Vertical event.
When collecting the Horizontal and Vertical events, aim to capture examples of both small and large gestures. This will enable your project to detect more diverse and robust events of interest.
Following these steps will enable you to effectively collect sensor data for your project and ensure the development of a reliable model.
First, click the Load option at the top of the Data Visualizer window pane.
Figure 1-4. Loading .json file to Variable streamer 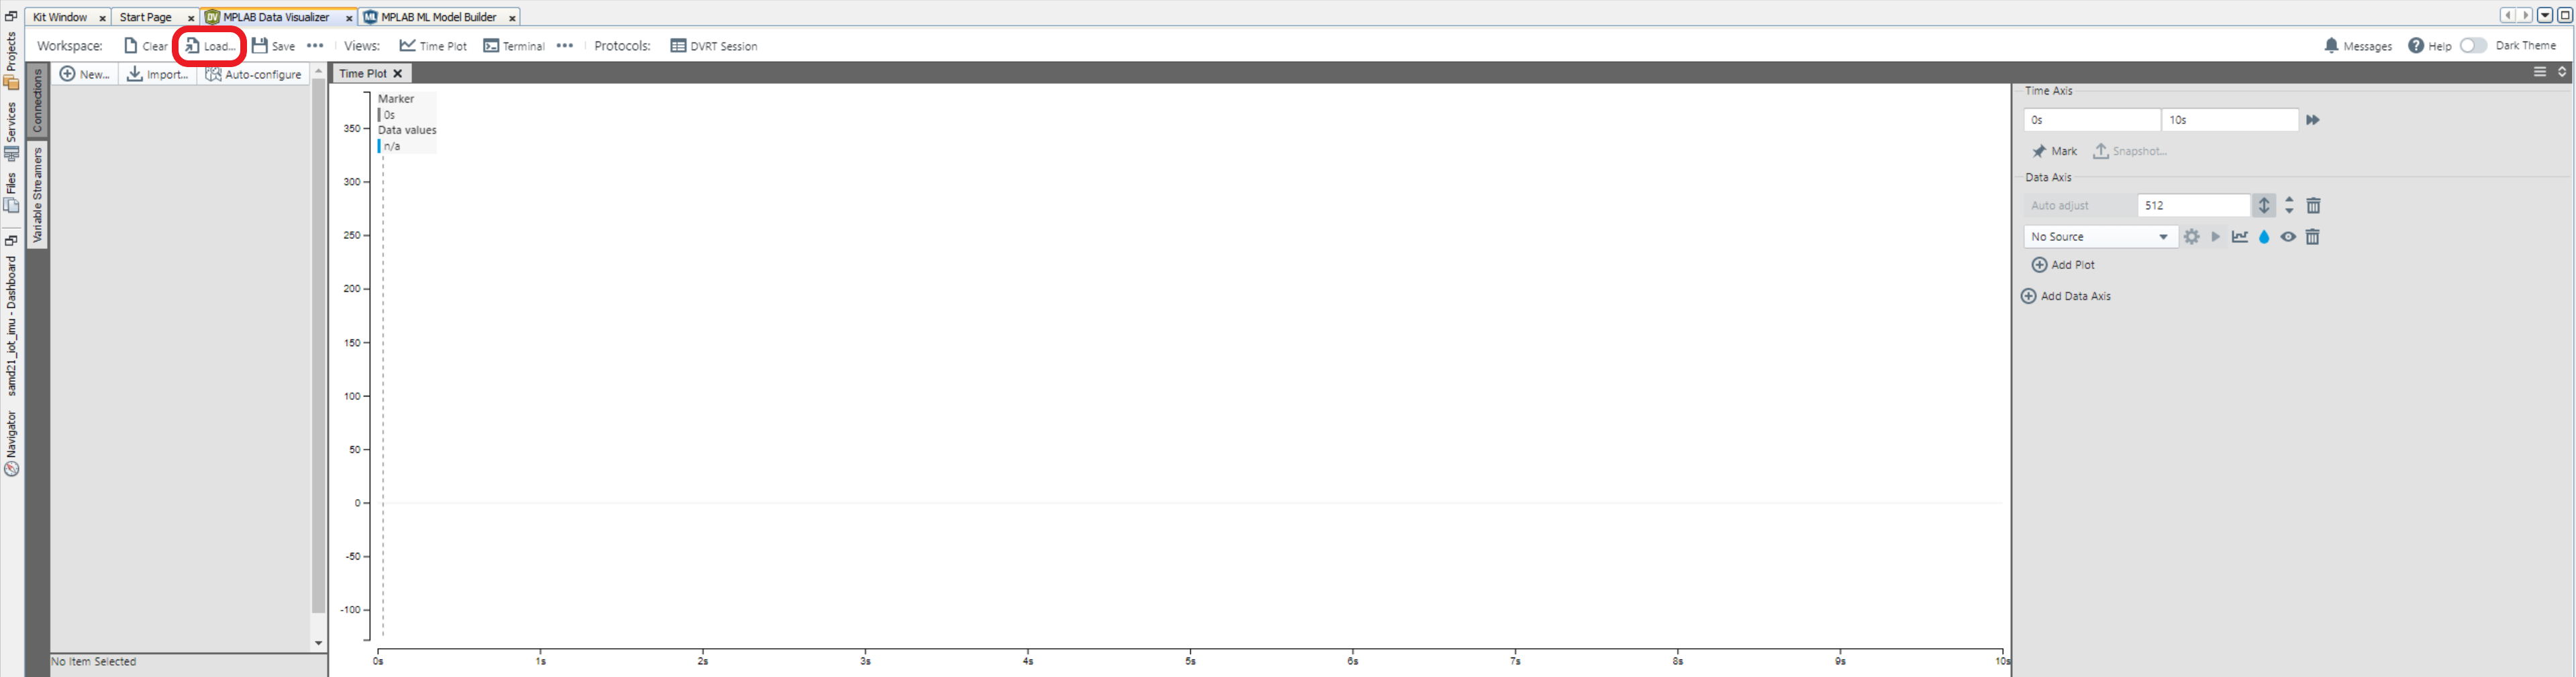
It will open up the ML SAMD21 IOT IMU Data Logger project where users need to navigate to the
mplab-dv-workspacefolder.Figure 1-5. Locating the .json variable streamer file 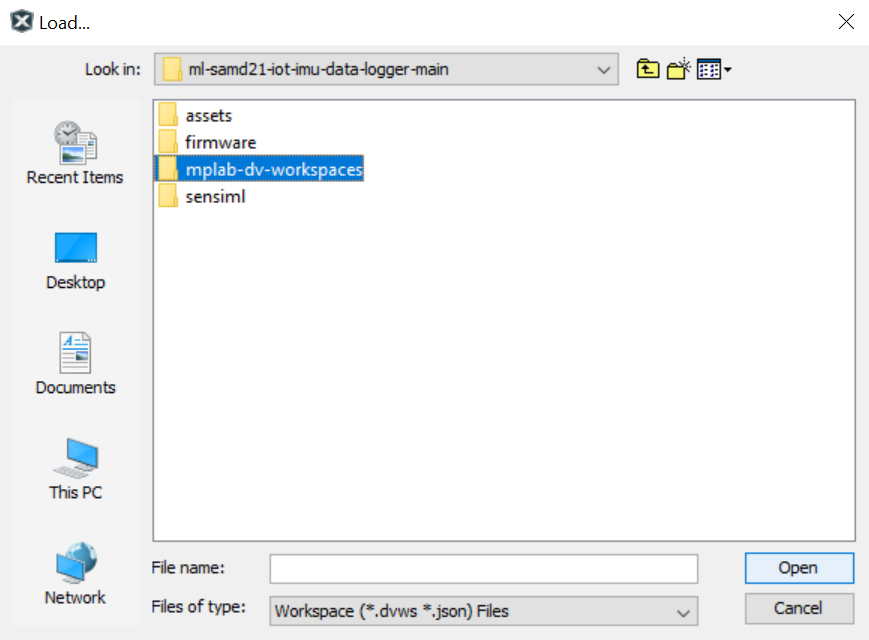
After opening the mplab-dv-workspaces folder, click the
dvws-6dof-imu-acc-gyr.jsonfile, which consists of six variables, three for the accelerometer and three for the gyroscope.. Click Open.Figure 1-6. Selecting the 6dof imu-acc-gyr.json file 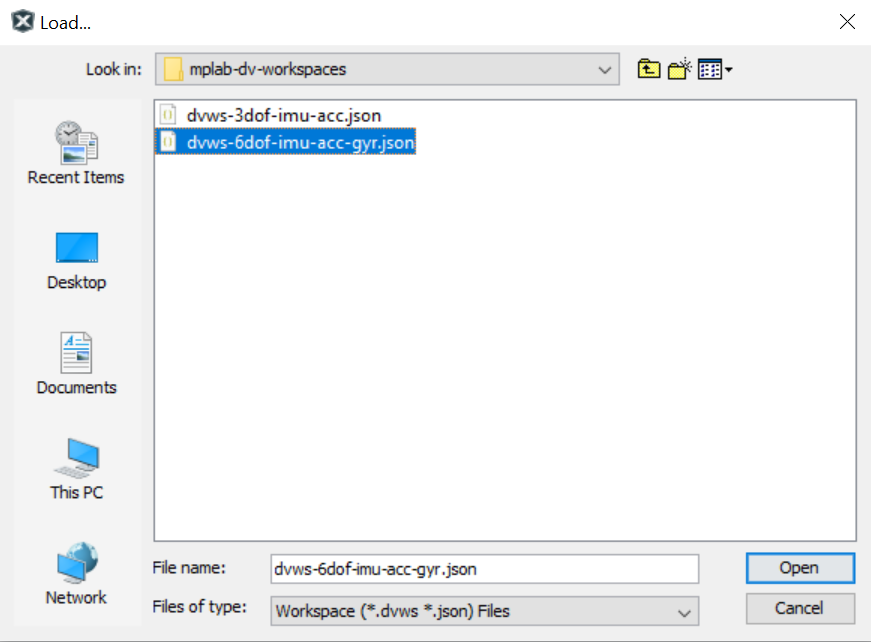
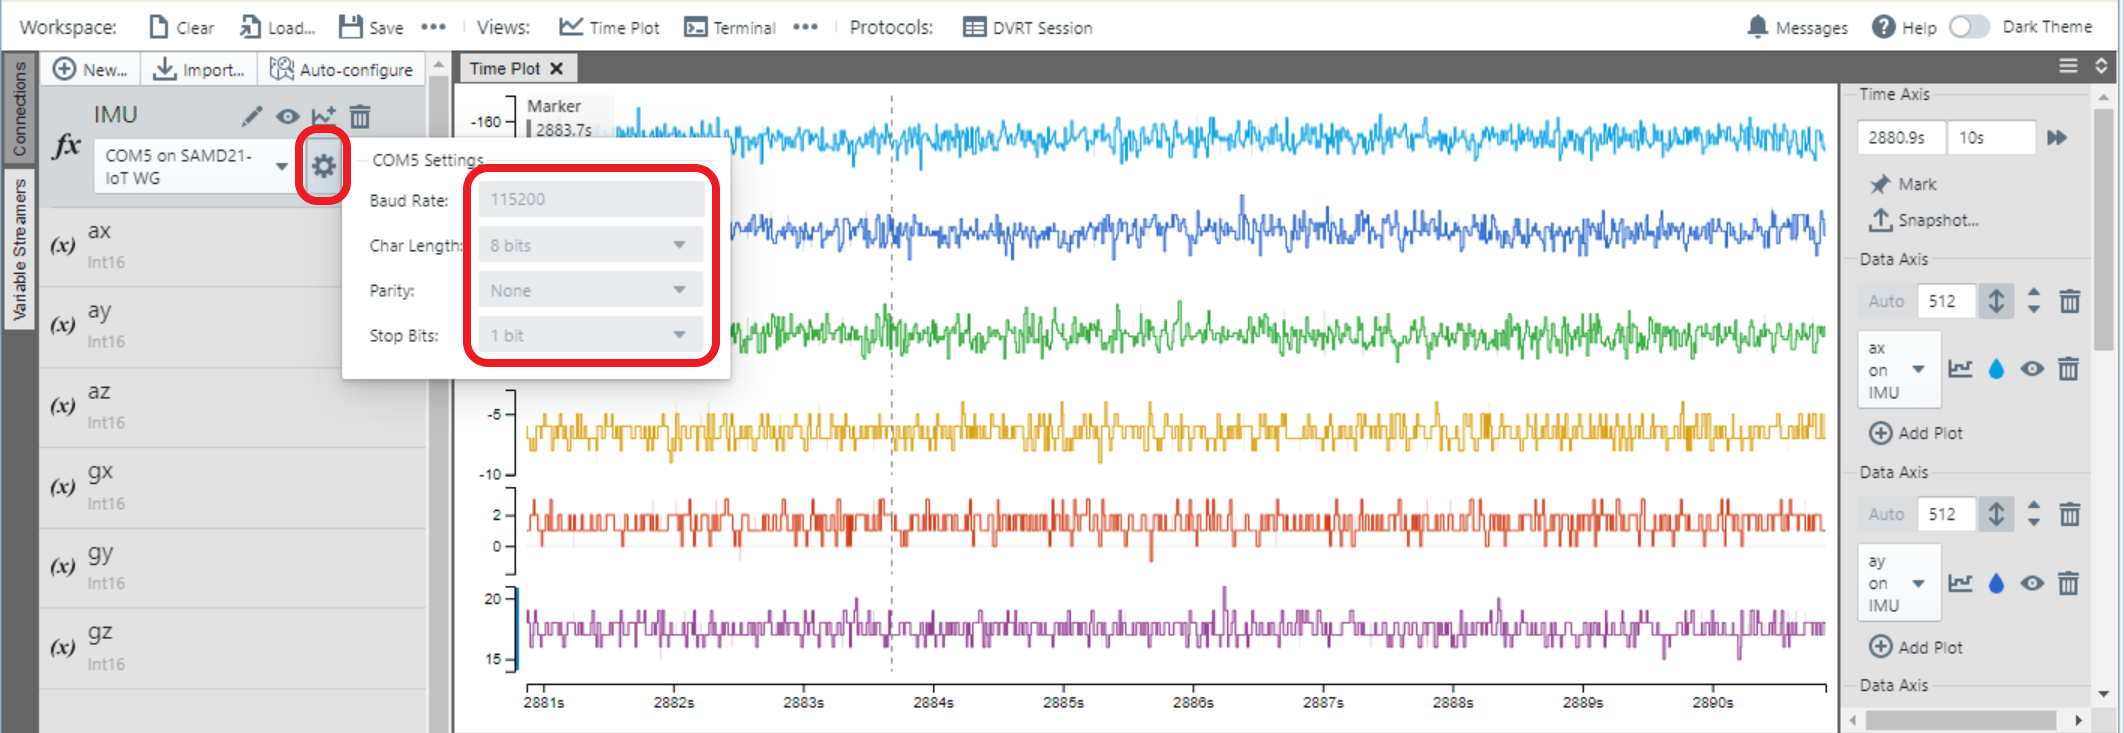
Next, click Variable Streamers, then, under the IMU section, select the COM port that the device is using as the source. Here, COM5 is being used, hence, it was selected.
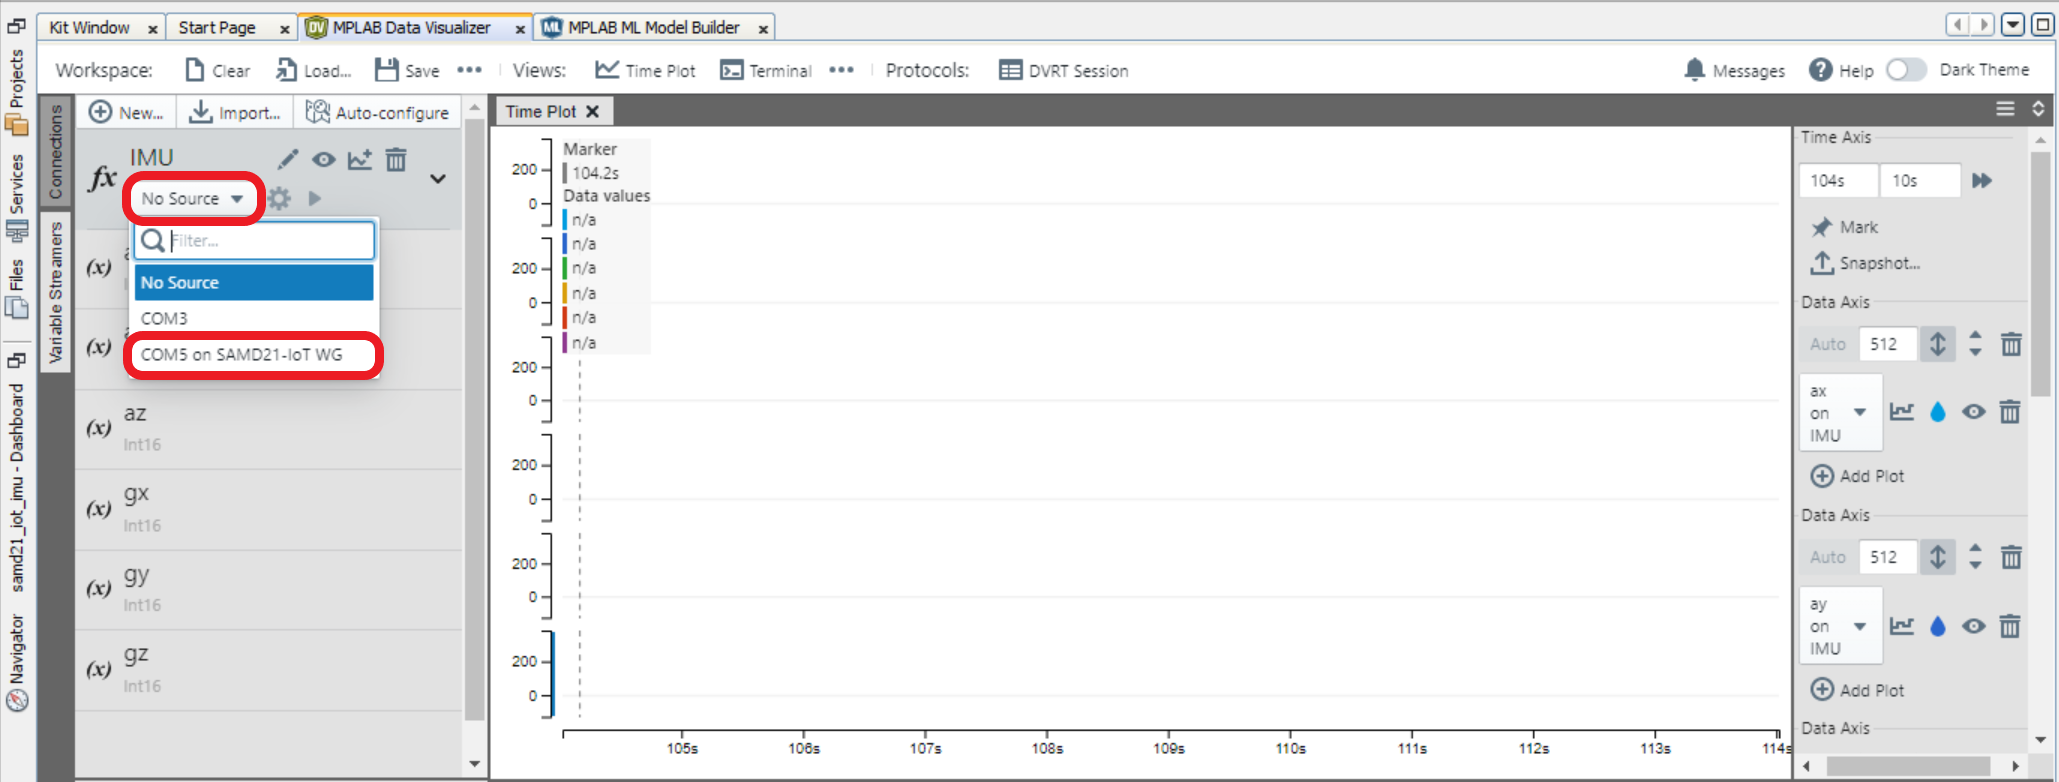
Click the circular ring located next to the source option, then set the baud rate to 115200.
Click the Show live Data option, which appears when the cursor is moved over the signal pane.
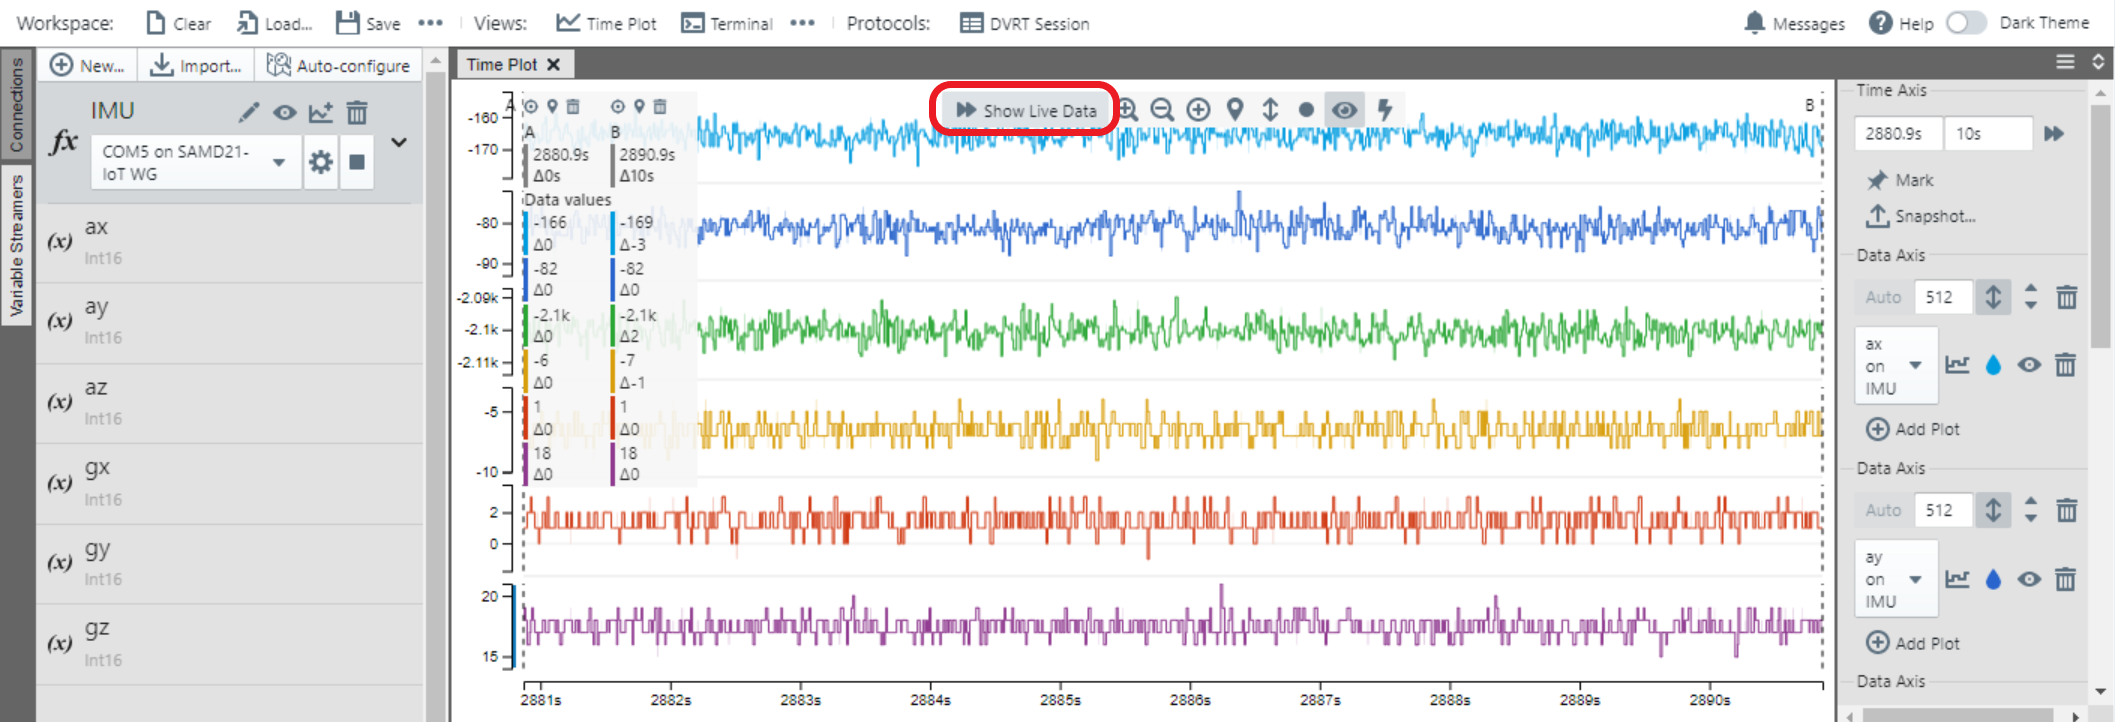
Perform a 60-second streaming operation on the device to collect data for the specified event type (Horizontal, Stationary, Vertical). When the streaming is complete, click the Upload Data button in ML Data Collector to proceed.
Figure 1-7. Uploading captured data tothe project through ML Data Collector 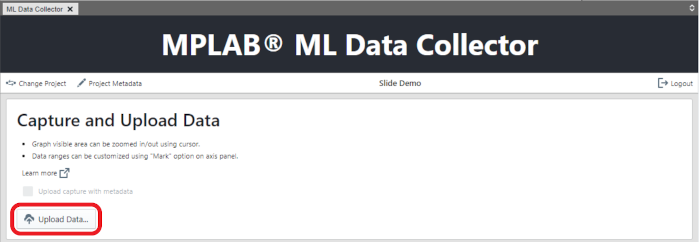
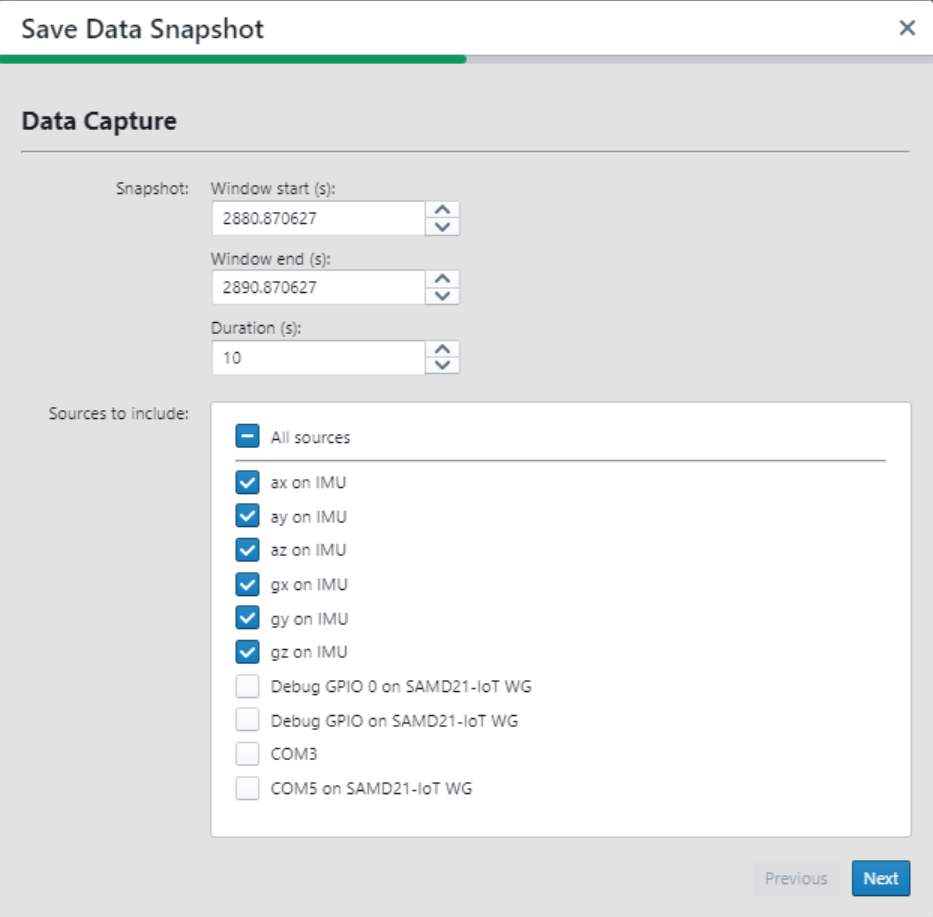
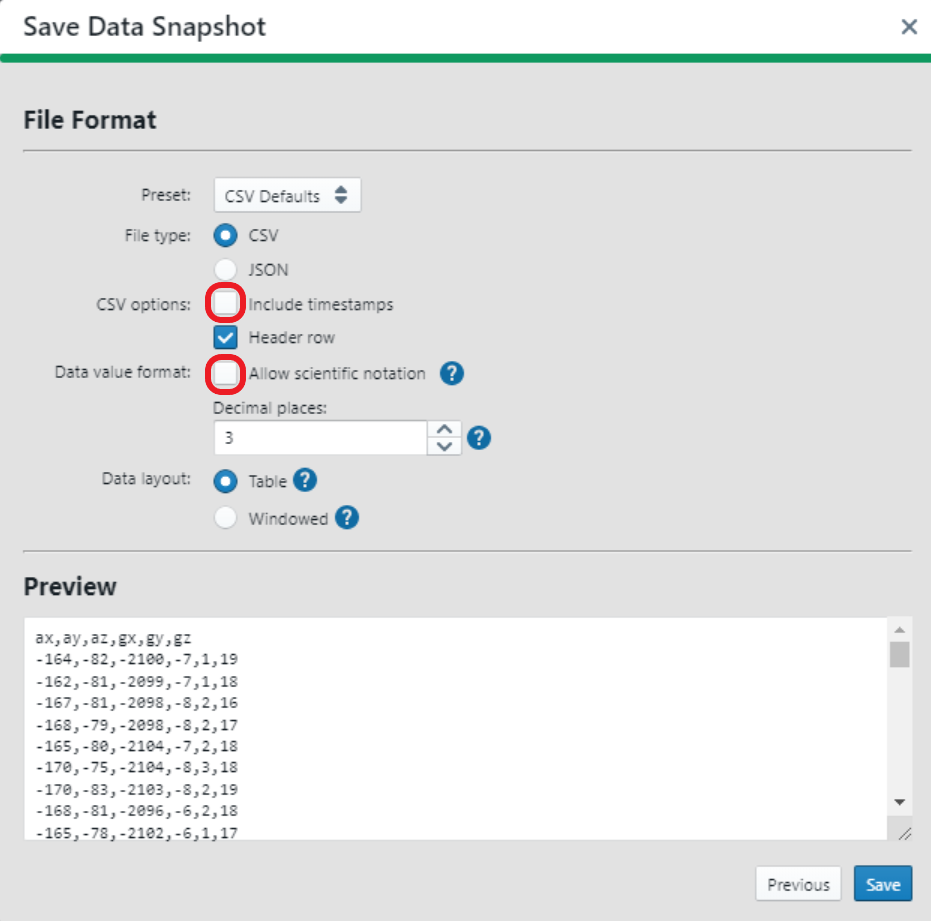
To select the 60-second window of your event and retrieve the accelerometer axis values, identify the start time of the desired window. Add 60 seconds to start and determine the end time. Retrieve the accelerometer axis values within the specified time range. Click Next.
Click Save.
The Comma-Separated Values (CSV) file format is selected. Make sure to deselect the “Allow scientific notation” and “Include timestamps” options.
Name the recorded event, then save it with the desired file name.
Figure 1-8. Saving the captured data files 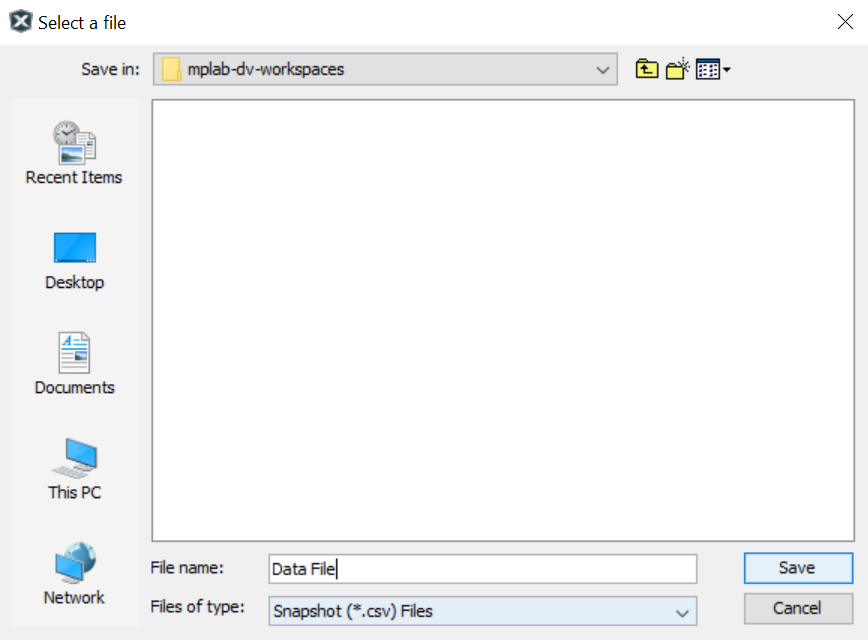
For more information about these steps, visit the Data Visualizer Variable Streamer User Guide.