2.15 Debugging 2: Conditional- and Action-Breakpoints
This section covers more advanced debugging topics with the Microchip Studio as both video (linked below) and hands-on document. The main topics are how to modify variables in the code, conditional- and action-breakpoints, and memory view.

- The code (see below) used is the same as the
one developed in section Editor: Writing and Re-Factoring Code (Visual
Assist). The SW_get_state() function has just
been replaced with the following code (also note the change in return value
type):
uint8_t SW_get_state(void)
{
    static uint8_t SW0_prv_state  = 0;
    static uint8_t SW0_edge_count = 0;

    uint8_t SW0_cur_state = !(PORTB.IN & PIN5_bm); /* Read the current SW0 state  */
    if (SW0_cur_state != SW0_prv_state)            /* Check for edges             */
    {
        SW0_edge_count++;
    }
    SW0_prv_state = SW0_cur_state;                /* Keep track of previous state */

    /*
     * Report the switch as pushed when it is pushed or the edge counter is a
     * multiple of 3
     */
    return SW0_cur_state || !(SW0_edge_count % 3);
}
Info: This code will count how many times the SW0 push button has been pressed or released. The return statement is modified to always report the button as pushed if the SW0_edge_count variable is a multiple of three. - Go to Debug → Disable All Breakpoints to disable all breakpoints, which should be reflected by all the checkboxes becoming unchecked in the Breakpoints window.
- Launch a new debug session by clicking the Start Debugging button
 .
. - Push SW0 on the kit several times and observe how the changes to the code have affected the LED's behavior.
- Break execution by placing a breakpoint at the return line of the SW_get_state function.
- Hover over the
SW0_edge_count variable to observe the current value, as
indicated in Figure 2-51.
Figure 2-51. Hover Over Variable to See Current Value  Info: When the cursor hovers over a variable in scope at the point when halting the execution, Microchip Studio will present the content of the variable in a pop-up.
 - Right click the
SW0_edge_count variable and select Add Watch from
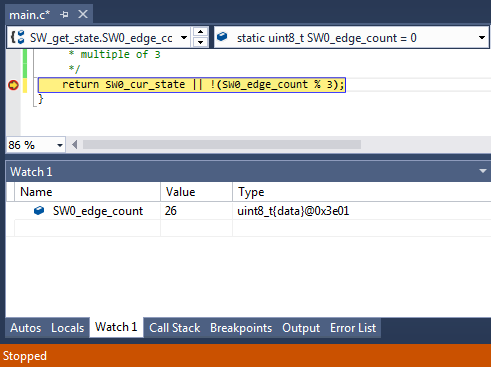
the context menu to add the variable to the data Watch window. The Watch window
should appear, with the SW0_edge_count variable listed, with
the variable value, data type, and memory address, as in Figure 2-52.
Figure 2-52. Add Variable to Watch Window 
- Modify the contents of a Watch Window
variable using the process described below. Assign the value '3' to the
SW0_edge_count variable. The value will reflect as
updated by turning red, as indicated in Figure 2-53.
- Double click a variable value in the Watch window
- Type in the desired new value of the variable
- Press Enter to confirm
Figure 2-53. Newly Updated Variable Value in the Watch Window  Info: Display the Value column in the Watch window in hex by right clicking in the Watch window and selecting Hexadecimal Display from the context menu.
 - To have the device evaluate the new value of
SW0_edge_count, disable all breakpoints and
continue the debug session by clicking
 or
pressing F5. Observe how the LED stays ON as a result of the change made to
SW0_edge_count.
A variable can be added to the Watch window by clicking on an empty field name and typing the variable name. This way, it is even possible to cast a variable to a different data type for better readability in the Watch window, which is especially useful if it is required to look at an array passed to a function as a pointer.
*(uint8_t (*)[<n>])<name_of_array_pointer>*(uint8_t (*)[5])&SW0_edge_countConditional Breakpoints
This section is a guide to using Microchip Studio to place conditional breakpoints.
- Clear all breakpoints from the project using the Breakpoints window.
- Place a breakpoint at the return line of SW_get_state(), as in Figure 2-54.
- Right click the breakpoint and select Conditions... from the context menu.
- Enter the following in the
condition
textbox:
((SW0_edge_count % 5) == 0) && SW0_cur_stateFigure 2-54. Conditional Breakpoint Expression Example 
- Press Enter to confirm the break condition.
- Continue/Start a new debug
session by clicking the
 button or pressing F5.
 - Push SW0 on the kit several times and observe how code execution is halted when the condition is fulfilled.
- Verify that the condition is met by double-checking the variable values in the Watch window.
Action Breakpoints
This section is a guide to using Microchip Studio to place action breakpoints.
- Stop the ongoing debug session and clear all the breakpoints from the Breakpoints window.
- Place a breakpoint at the SW0_prv_state = SW0_cur_state; line, as in Figure 2-55.
- Right click the breakpoint and select Actions... from the context menu.
- Enter the following in the
output message text
box:
Prv state:{SW0_prv_state}, Cur_state:{SW0_cur_state}, Edge count:{SW0_edge_count}Figure 2-55. Action Breakpoint Example 
- Press Enter to confirm.
- Start a debug session.
- Open the Debug Output window
by going to Debug → Windows → Output. It should list the variable
contents as in Figure 2-56. If clicking
SW0 on the kit, the content is updated.
Figure 2-56. Debug Output Window Showing Variable Contents 
Code Used (for ATtiny817 Xplained Pro)
Code used for conditional- and action breakpoints.
#include <avr/io.h>
#include <avr/interrupt.h>

void LED_on();
void LED_off();
uint8_t SW_get_state();
void LED_set_state(uint8_t SW_state);

int main(void)
{
	PORTB.DIRSET = PIN4_bm;
	PORTB.OUTSET = PIN4_bm;
 	PORTB.PIN5CTRL |= PORT_PULLUPEN_bm | PORT_ISC_BOTHEDGES_gc;
	sei();

    while (1)
    {
    }
}

#pragma region LED_functions
void LED_on()
{
	PORTB.OUTCLR = PIN4_bm;  //LED on
}

void LED_off()
{
	PORTB.OUTSET = PIN4_bm;  //LED off
}

void LED_set_state(uint8_t SW_state)
{
	if (SW_state)
	{
		LED_on();
	}
	else
	{
		LED_off();
	}
}
#pragma endregion LED_functions


uint8_t SW_get_state(void)
{
    static uint8_t SW0_prv_state  = 0;
    static uint8_t SW0_edge_count = 0;

    uint8_t SW0_cur_state = !(PORTB.IN & PIN5_bm); /* Read the current SW0 state  */
    if (SW0_cur_state != SW0_prv_state)            /* Check for edges             */
    {
        SW0_edge_count++;
    }
    SW0_prv_state = SW0_cur_state;                /* Keep track of previous state */

    /*
     * Report the switch as pushed when it is pushed or the edge counter is a
     * multiple of 3
     */
    return SW0_cur_state || !(SW0_edge_count % 3);
}

ISR(PORTB_PORT_vect)
{
	uint8_t intflags = PORTB.INTFLAGS;
	PORTB.INTFLAGS = intflags;

	uint8_t SW_state = SW_get_state();

	LED_set_state(SW_state);
}
