
4.3.1.4.2 Plot Cursors
A vertical cursor can be used in a similar manner to the
plot marker, except that the cursor does not follow mouse movements; it must be dragged
to a position and it will not move until dragged again. To add one or more cursors to
the display, hover over the top of the graph and click on the “Add vertical cursor...”
icon  .
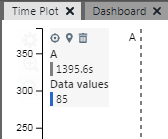
“Inspect Values” will then display cursor values in place of marker values (see
figure).
.
“Inspect Values” will then display cursor values in place of marker values (see
figure).
 | Jump to cursor. The cursor will be centered on the graph and scrolling is paused. If the cursor has scrolled away with the plot, jump to its location. |
 | Reposition the cursor to the center of the graph. Hold the shift key when repositioning to move all cursors the same amount. |
 | Delete the cursor. |
| A, B, C, etc. | The letter number of the cursor. |
| Time Values | For each cursor, the value where the cursor intersects the time axis
is displayed (timestamp). For two or more cursors, a time difference (delta) is displayed, with the leftmost cursor as reference. |
| Frequency Value | For two or more cursors, hover over the time values to see a frequency value, with the leftmost cursor as reference. |
| Data Values | For each cursor, the value where the cursor intersects the data plot
is displayed. If there is more than one plot, a color bar corresponding
to the plot color will signify the associated data value. For two or more cursors, a data difference (delta) is displayed, with the leftmost cursor as reference. |
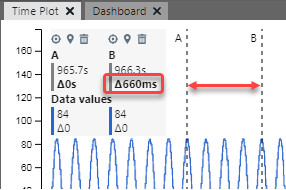
Use Two Cursors for Bandwidth
Two vertical cursors can be used to determine bandwidth. Using the time delta, for example in the figure below, the time difference between the position of A and of B is 660 ms. Therefore the bandwidth is 660 ms / 4 cycles ≅ 165 ms/cycle.
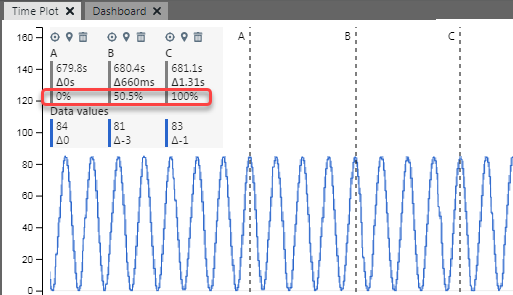
Use Three Cursors for Duty Cycle
Adding a third cursor allows you to calculate the duty cycle. If A-C is the period, then A-B is shown as a percentage of that (50.5%).
Additional cursors may be added to the graph.