4.3.1.4.1 Plot Marker
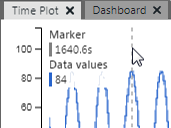
The time plot marker is a dashed vertical line that follows
mouse movements along the time axis. Time and data values for the current location of
the marker are displayed in the top left corner of the graph. To toggle this display,
hover over the top of the graph and click on the “Toggle Inspect Values” icon  .
.

