4.3.5.1.5 Open MPLAB Data Visualizer
Open the MPLAB Data Visualizer plug-in by clicking the toolbar icon  or
selecting Windows>Debugger>Data Visualizer.
or
selecting Windows>Debugger>Data Visualizer.
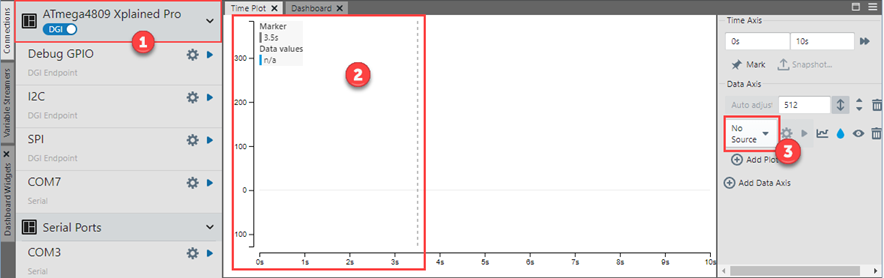
- In the Data Source pane, on the Connections tab, you should see “ATmega4809 XPlained Pro” with “DGI” enabled.
- In the Graph tab, the sliding marker (dashed gray line) will be at zero and there will be no data values (if available would be blue to match source color).
- In the Visualization pane, the “Source” box for the Time Axis should say “No Source.”