4.3.5.1.6 Debug Project and Visualize Output
To begin debugging the project, click on the “Debug Project” icon  .
.
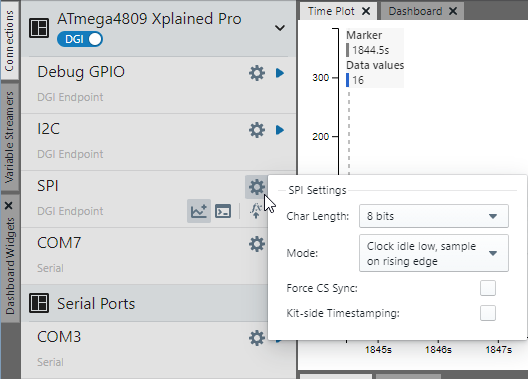
In MPLAB Data Visualizer, under “ATmega4809 Xplained Pro” (DGI enabled), are the available connections. On the SPI connection, click on the gear icon to view SPI settings. For details on what these settings mean, see SPI Interface.
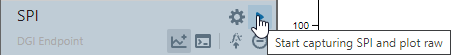
In general to begin streaming data, click on the arrow to plot raw data. However, for this example variable data will be plotted.
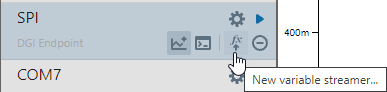
To plot streaming variable data, set up a variable streamer by clicking the fx control (New Variable Streamer).