
4.7.2.2.6 Graph
The Graph widget plots the incoming data streams in a two-dimensional graph. The graph can be configured to accept zooming and scrolling by mouse interaction or to be static ignoring any mouse interaction.
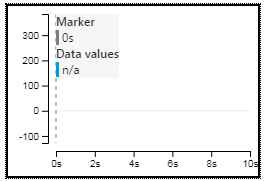
Data Fields
Add a data source to the plot as with a Time Plot.
Configuration